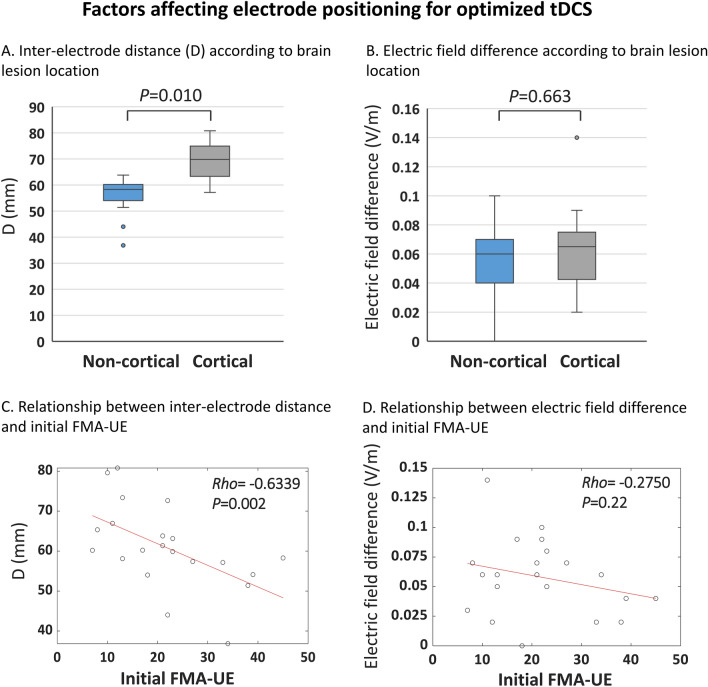
Figure 3.
Factors affecting electrode positioning for optimized tDCS. (A) The distances (Ds) between conventional and optimized tDCS electrodes in groups with cortical and non-cortical lesions. (B) The target electric field differences between conventional and optimized tDCSs. The midlines of the boxes indicate the medians of A and B, the ends of the boxes the interquartile ranges (25–75%), and the whiskers the minima and maxima. (C) Correlations between the Ds and the initial Fugl-Meyer Assessment of upper extremity (FMA-UE) scores. The best-fitting regression lines are superimposed. (D) Correlations between the target electric field differences of the two tDCSs and the initial FMA-UE scores. Rho: Spearman correlation coefficient.

