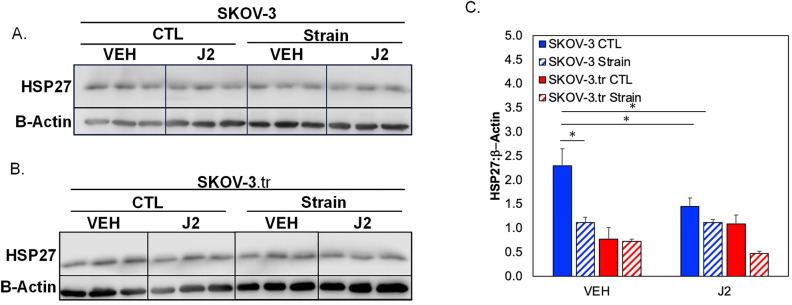
Figure 4.
Western blot analysis of total HSP27 expression in SKOV-3 and SKOV-3.tr cell lines with J2 inhibition. (A) Images of Western Blot analysis of total HSP27 in SKOV-3 cells subjected to 10 μM J2 treatment and strain stimulation (30 min). (B) Images of Western blot analysis of total HSP27 in SKOV-3.tr cells subjected to 10 μM J2 treatment and strain stimulation (30 min). Cropped images shown; full membranes in Supplemental Data section. All controls (CTL) were plated on Flexcell plates but were not exposed to strain. (C) Quantification of normalized HSP27 expression Western blot samples; Legend: Blue represents SKOV-3 samples and red represents SKOV-3.tr samples. All bands were normalized to β-actin as a loading control. Data shown as average + SEM; N = 3 samples; *p < 0.05. Samples were compared with ANOVA and post-hoc Tukey HSD tests.

