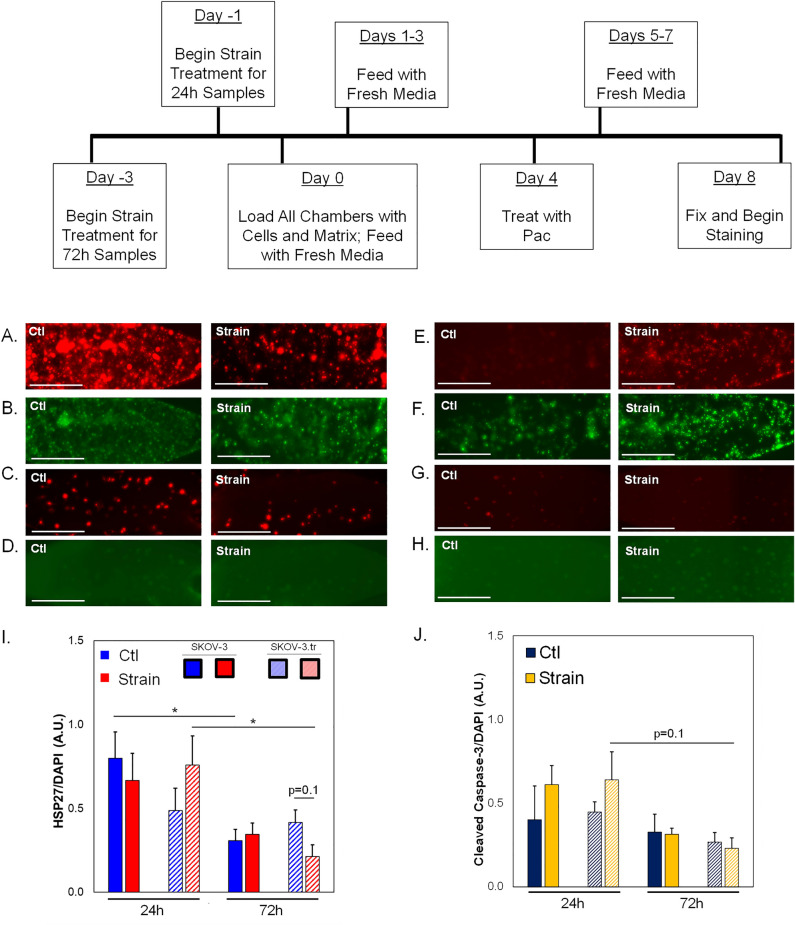
Figure 6.
HSP27 and Cleaved Caspase-3 expression in 3D TME models treated with Paclitaxel. (A–H) Representative fluorescence images of side microtissue regions in devices with either SKOV-3 (A–D) or SKOV-3.tr (E–H) cells treated with 24 h (A,B,E,F) or 72 h (C,D,G,H) of strain compared to control (non-strained) cells. HSP27 immunofluorescence (A,C,E,G—TXRED) or Cleaved Caspase-3 (B,D,F,H—GFP) (I) Quantification of HSP27 expression normalized to DAPI fluorescence. (A,C,E,G). (J) Quantification of Cleaved Caspase-3 expression normalized to DAPI fluorescence (B,D,F,H). cale bar = 100 µm. Solid color bars are SKOV-3 samples; lines represent SKOV-3.tr samples.Data shown as average + SEM; N = 3 samples; *p < 0.05. HSP27 data was compared with Kruskal-Walls and post-hoc Dunn’s tests; CC-3 data was compared with ANOVA and post-hoc Tukey HSD tests.

