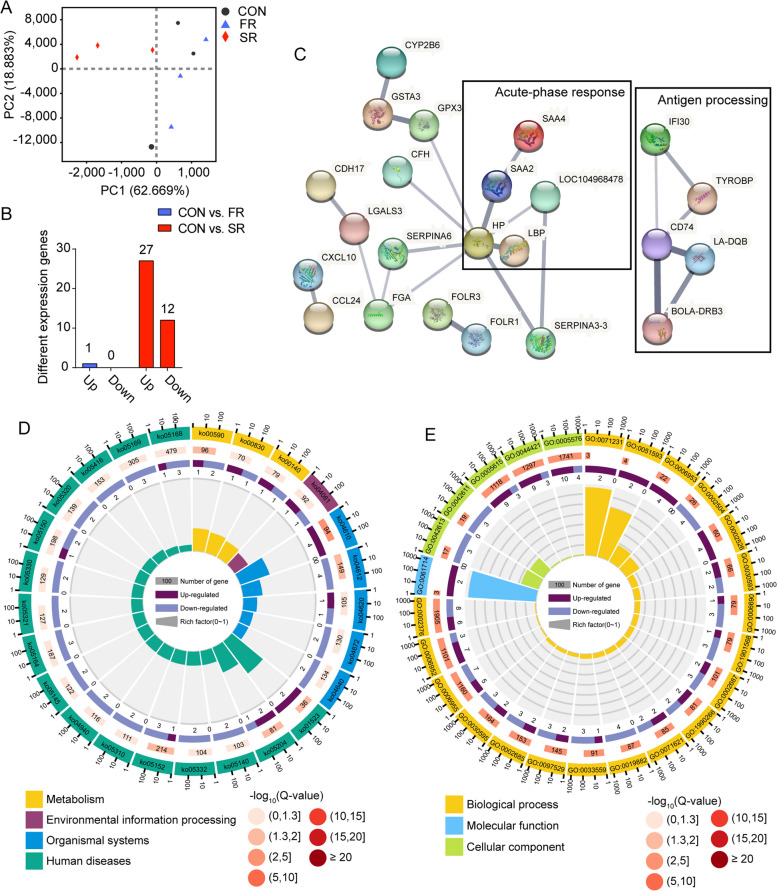
Fig. 5.
Effects of rumen microbiota transplantation (FR), sterile rumen fluid transplantation (SR) on gene expression in the liver. The dairy cows in the CON group received 10 L saline daily. A Principal component analysis (PCA) of gene expression in the liver on d 7. B Number of different expression genes on d 7 in the FR and SR groups when compared with the CON group. C Protein-protein interactions of different expression genes between CON group and SR group using STRING database. The line thickness indicates the strength of data support. The black box indicates the genes in the box contribute to the same function. D KEGG enrichment of different expression genes on d 7 between the CON group and SR group. The first lap shows the top 25 KEGG terms and the number of genes corresponds to the outer lap. The second lap indicates the background genome and P value for enrichment of the differential expression genes. The third lap indicated the ratio and number of the upregulated genes (deep purple) and downregulated genes (light purple). The fourth lap shows the enrichment factor of each KEGG term. E GO enrichment of differential expression genes on d 7 between the CON group and SR group. The legend was similar to D as mentioned above. n = 3

