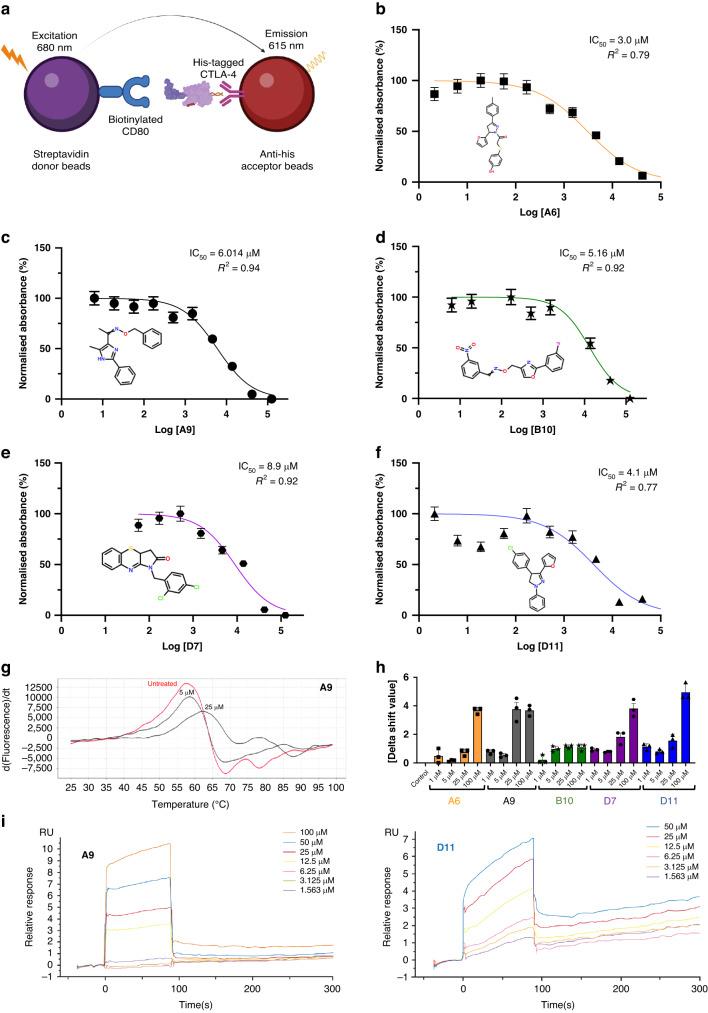
Fig. 1. AlphaLISA, protein thermal shift, and surface plasmon resonance of anti-CTLA-4 lead compounds.
a The AlphaLISA method. The method consisted of 2 components: (1) streptavidin donor beads containing biotinylated CD80, and (2) anti-His acceptor beads containing His-tagged CTLA-4 antibodies. CD80 and CTLA-4 disrupt the 2-component system, reducing luminescence emission at 615 nm. b–f IC50 of the top 5 leading compounds. The values were measured as a reduction in 615-nm luminescence (color-coded panels). The lead compounds were (b) A6, (c) A9, (d) B10, (e) D7, and (f) D11 (n = 3). g PTS dose-response curves. The absolute value of the delta thermal shift indicates binding between CTLA-4 purified protein and lead compounds. The dose-dependent (5-µM and 25-µM) PTS changes in melting temperatures for the representative A9 lead compound is represented. h Summarized PTS data for the top 5 lead compounds’ dose-response results (5 µM, 25 µM, 50 µM, and 100 µM). i SPR dose-response curves for D11 and A9 are illustrated. The values are the means of 3 experiments done in triplicate. AlphaLISA amplified luminescent proximity homogeneous LISA, CTLA-4 cytotoxic T-lymphocyte–associated protein 4, d delta, dT delta temperature, IC50 half-maximal inhibitory concentration, PTS protein thermal shift, RU relative unit, SPR surface plasmon resonance.

