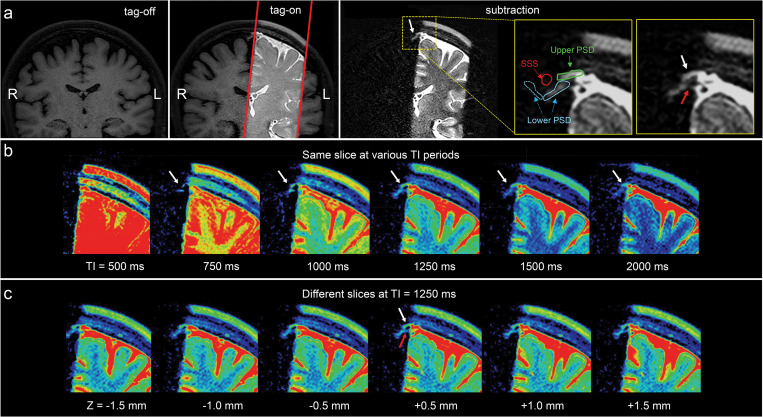
Fig. 4.
(a) Images of tag-off, tag-on, subtraction, and the enlargement of the subtraction obtained at TI of 1500 ms. The Time-SLIP pulse is shown in the red rectangular box. Enlarged images with and without labels show fluid moving out from the tagged region (left brain hemisphere) to the PSD (white arrows) extended from the dura mater and the lower PSD (red arrow). Segmented labels (enlargement on the right) show upper (or horizontal) parasagittal dura (PSD in green), lower (or lateral) PSD (light blue), left lower PSD in a solid line and the right lower PSD in a dotted line, and SSS in red. Note that the signal by the red arrow shows a possibility of a second pathway of CSF flow. Note that there are no noticeable signals at the right upper PSD and lower PSD from the right brain hemisphere consistent with no Time-SLIP pulse applied to this hemisphere. (b) Color map of subtracted images from the center slice at Z = 0 mm location of 3D images at TI of 500, 750, 1000, 1250, 1500, and 2000 ms. The tagged CSF moved out to PSD at 750 ms, increases signals at TI of 1000 to 1250 ms, and gradually decreased in signal intensity by TI of 2000 ms (white arrows). (c) Contiguous slices of subtracted color maps of 3D volume images obtained at TI of 1250 ms. Note that contiguous slices show marked movement of CSF toward the upper PSD (white arrow) in every slice (or a 3 mm Z direction distance) of 3D volume images. In addition, the tagged CSF movement toward the lower PSD can be seen (red arrow). CSF, cerebrospinal fluid; PSD, parasagittal dura; SSS, superior sagittal sinus; Time-SLIP, time-spatial labeling inversion pulse.

