Fig. 5.
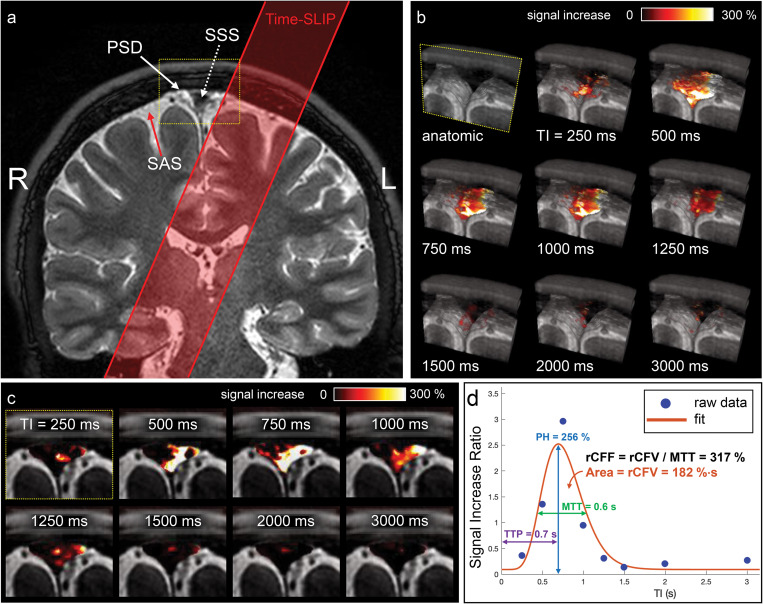
(a) Coronal 3D cSSFSE image with a spin labeling tag pulse (red box). The Time-SLIP tag pulse is placed about 10 mm away from the SSS. (b) A series of oblique 3D spin labeling images with various TIs fused over 3D cSSFSE image, enlargement of yellow box in (a). Note that the tagged signals increase from the Time-SLIP on the left brain at the PSD region at TI of 500 ms and then disappear or egress into the SSS by 1500 ms. (c) Straight coronal fusion images of tagged MRI signals around the SSS region over 3D cSSFSE images at various TIs show tagged fluid outflow from the tag pulse to dura mater and PSD into the SSS. (d) Tagged CSF outflow signal at the SSS. Circles show the data points and the line indicates the curve fit. PH is 256%, MTT is 600 ms, TTP is 700 ms, rCFV is 182%∙sec under the curve, and rCFF is 317%, obtained by dividing rCFV by MTT. CSF, cerebrospinal fluid; cSSFSE, centric ky–kz single-shot fast spin echo; MTT, mean transition time; PH, peak height; PSD, parasagittal dura; rCFF, relative CSF flow; rCFV, relative CSF volume; SSS, superior sagittal sinus; TIs, inversion times; Time-SLIP, time-spatial labeling inversion pulse; TTP, time to peak.

