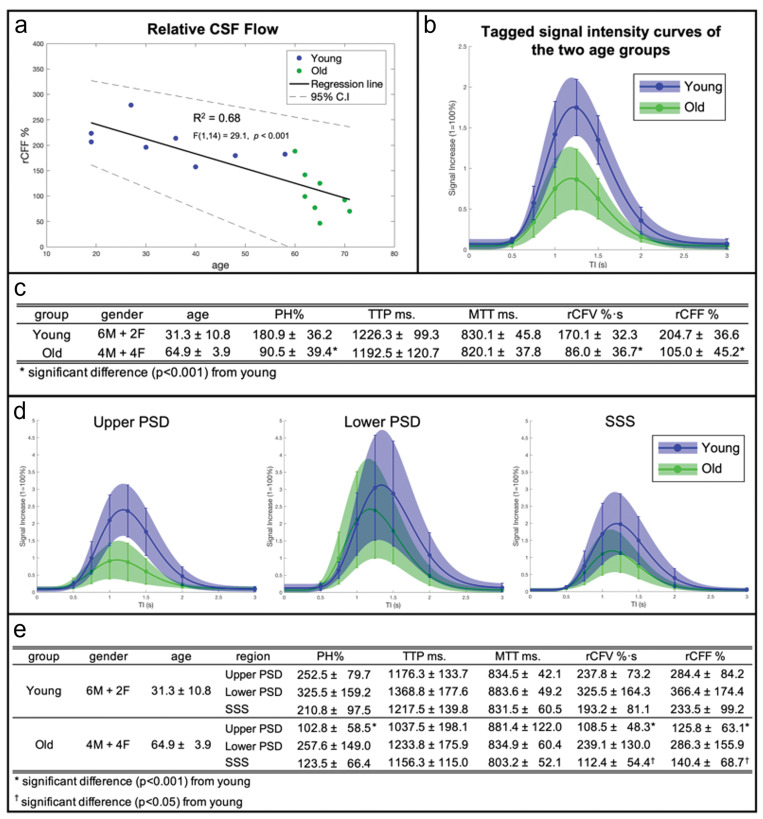
Fig. 6.
(a) CSF outflow of the entire SSS region on 16 participants between 19 and 71 years show a decline of outflow with age (there was a negative correlation F(1,14) = 29.1, P < 0.001, r = –0.82). Especially in those over 60 years of age, the Spearman’s rank-order correlation gives a strong negative correlation between rCFF and age, which was statistically significant (rs(14) = –0.912, P < 0.0001) in green dots. (b) Tagged fluid outflow rate of entire meninges in two groups: younger (19–59 years) and older (60–71 years) adults. The curves represent an average SIR fit of each age group with the colored shades denoting an SD range and SD bars at each TI point. The amount of outflow signal is markedly decreased in the older group, as compared to the younger group. (c) Quantitative CSF outflow measures between the younger and older groups. Tagged CSF outflow measures are PH, rCFV, and rCFF for each age group and for all participants. The TTP and MTT values were similar in the two groups; however, PH (180.9% ± 36.2 in young and 90.5% ± 39.4 in old; t(14) = –4.78, P < 0.001), rCFV (170.1%∙s ± 32.3 in young and 86.0%∙s ± 36.7 in old; t(14) = –4.87, P < 0.001), and rCFF (204.7% ± 36.6 in young and 105.0% ± 45.2 in old; t(14) = –4.85, P < 0.001) were significantly different between the two age groups using a two-sample t-test with unique variance. (d) Individual ROI analysis of upper PSD, lower PSD, and SSS in younger and older age groups and their quantitative measures (e). Similarly, as in (b), the curves represent an average SIR fit of each age group with colored shades denoting an SD range and SD bars at each TI point. The upper PSD shows a significant difference in PH (252.5% ± 79.7 in young and 102.8% ± 58.5 in old; t(14) = –4.28, P < 0.001), rCFV (237.8%∙s ± 73.2 in young and 108.5%∙s ± 48.3 in old; t(14) = –4.17, P < 0.001), and rCFF (284.4% ± 84.2 in young and 125.0% ± 63.1 in old; t(14) = –4.26, P < 0.001) between younger and older groups. The lower PSD shows no significant difference. SSS presents a significant difference in rCFV (193.2%∙s ± 81.1 in young and 112.4%∙s ± 54.4 in old; t(14) = –2.34, P < 0.05) and rCFF (233.5% ± 99.2 in young and 140.4% ± 68.7 in old; t(14) = –2.18, P < 0.05) between the two age groups using a two-sample t-test with unique variance. Note that the TTP is similar between the upper PSD and SSS, but slightly longer in SSS whereas TTP of the lower PSD is longer than that of upper PSD and SSS. CSF, cerebrospinal fluid; MTT, mean transit time; PH, peak height; PSD, parasagittal dura; rCFF, relative CSF flow; rCFV, relative CSF volume; SD, standard deviation; SIR, signal increase ratio; SSS, superior sagittal sinus; TTP, time-to-peak.

