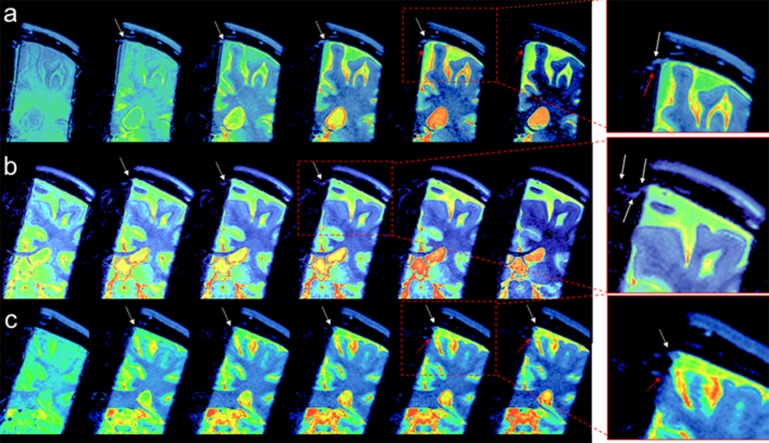
Supplementary Fig. 2.
Three subtraction color images of tagged CSF at TI of 500, 750, 1000, 1250, 1500, and 2000 ms of (a) 30 years old male, (b) 19 years old male, and (c) 36 years old female participants. Enlargements show the CSF from dura mater (white arrows). (a) and (c) show a signal from another route near the lower PSD (red arrows). (b) shows tagged CSF signals that seem to travel to the left lower PSD and then to the right lower PSD.

