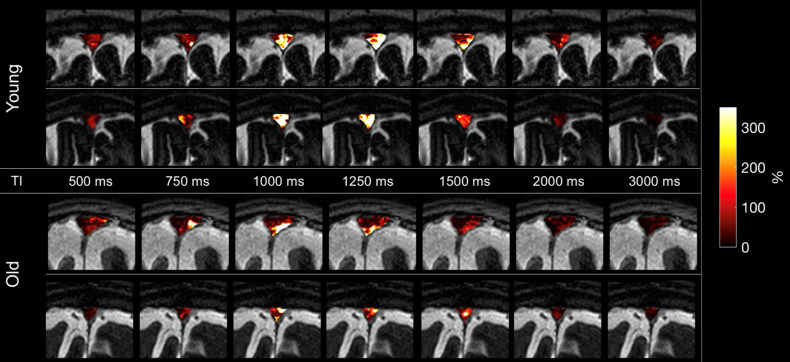
Supplementary Fig. 3.
Four example images of tagged glymphatic color maps at TI of 500, 750, 1000, 1250, 1500, 2000, and 3000 ms in two younger (top) and two older (bottom) adults. The younger adults show bright signals in the SSS region 1000–1500 ms; signals in the older adult images are less bright. Note that the fusion image with TI 500 ms was used with tagged MRI color images covering the entire SSS region including upper PSD, lower PSD, and SSS at a slice of 3D images using various TI periods.

