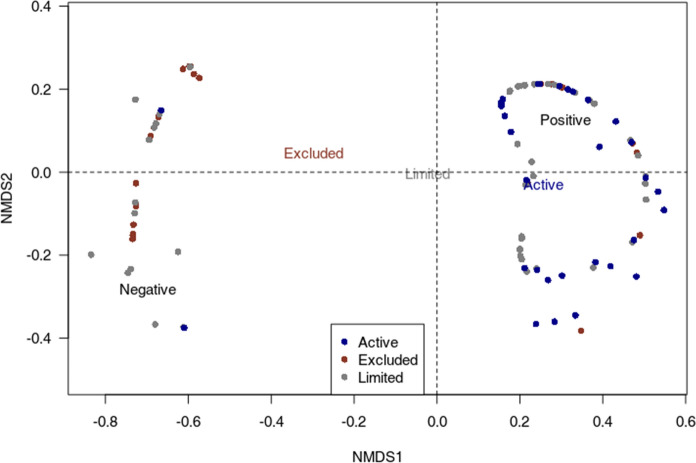
Fig. 4.
Non-metric multidimensional scaling (NMDS) ordination plot illustrating differences in impact direction among women’s level of participation in SSF management processes (i.e., excluded, limited, active). The points to the left are impacts perceived as negative, the ones to the right are positive; colours indicate women’s participation level in SSF management, and the coloured words indicate the estimated centre of each management category in this space

