Fig. 4.
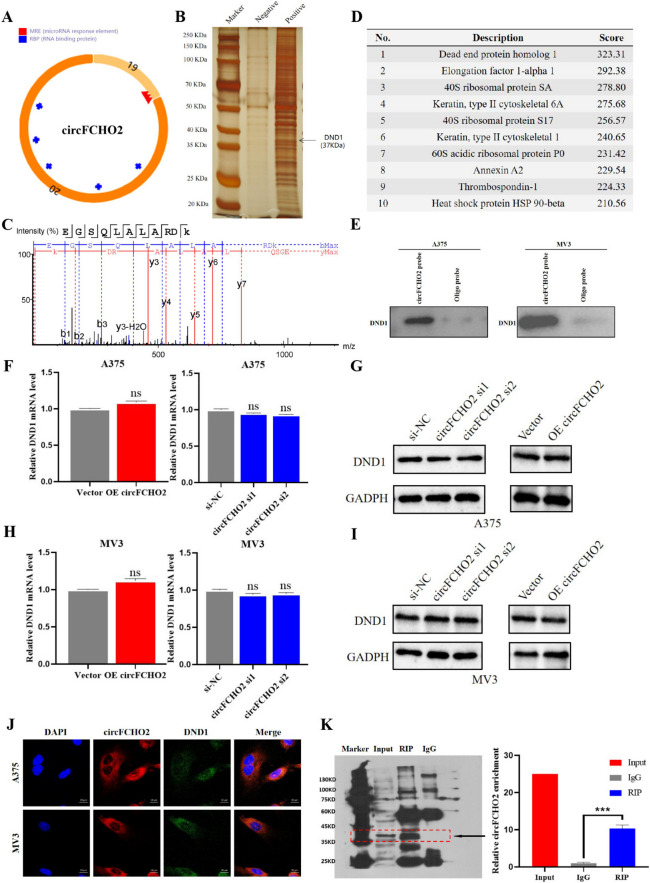
circFCHO2 physically interacts with DND1. A The visualization structure of circFCHO2 in the CSCD database (http://gb.whu.edu.cn/CSCD/). The blue mark represents the RBP binding site while the red mark represents the miRNA binding site. B Silver staining image of RNA pull-down assay with circFCHO2 (positive) and control (negative) probes. C, D Mass spectrometry analysis of circFCHO2-binding proteins after RNA pull-down assay and list of top ten differentially expressed proteins identified by mass spectrometry. E Levels of DND1 protein were detected in the proteins pulled down by circFCHO2 and oligo probes. F–I Levels of DND1 mRNA and protein in circFCHO2-overexpressing and circFCHO2-knockdown melanoma cells were quantified by qRT-PCR and western blotting. GADPH served as the internal control. J Representative images of circFCHO2 and DND1 colocalization in melanoma cells detected by FISH assay. K RIP assays revealing circFCHO2 enrichment by DND1 in A375 cells. Unpaired Student’s t-test and Mann–Whitney U test were used for the statistical analyses. ***P < 0.001; ns, no significant

