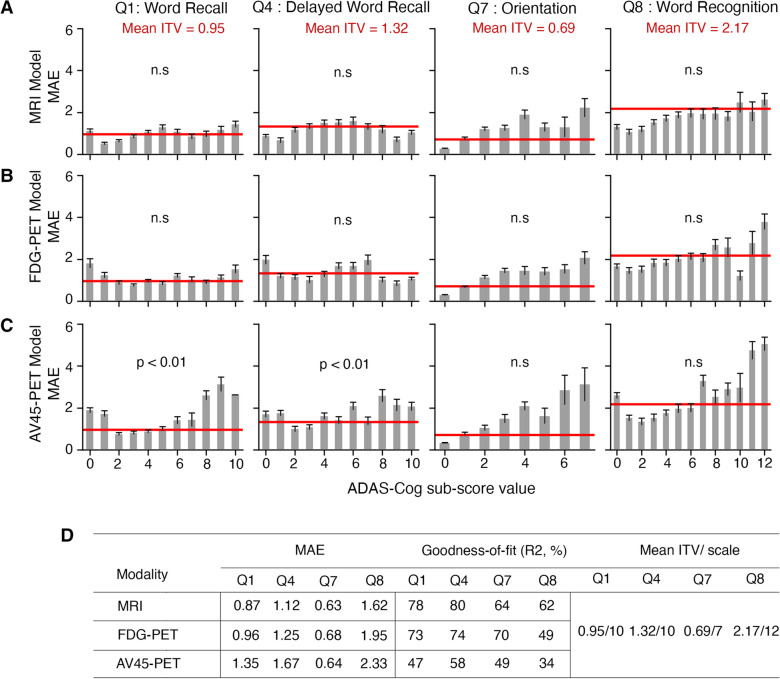
Fig. 2.
Accuracy of CNN models on predicting ADAS–Cog13 sub-scores. A–C Graphical representation of the mean absolute error (MAE) across ADAS–Cog sub-scores for the MRI (A), FDG–PET (B) and AV45–PET (C) CNNs. The inter-test variabilities (ITVs) for four ADAS–Cog13 sub-scores are represented by the red horizontal line. One-tailed t tests was performed to compare MAEs and ITVs for each ADAS–Cog13 sub-score. ‘n.s.’ means there is no significant difference between MAE and ITV. D Test set MAE and R2 for the MRI, FDG–PET and AV45–PET-based CNN models, along with the mean ITV and scale of each ADAS–Cog13 sub-score

