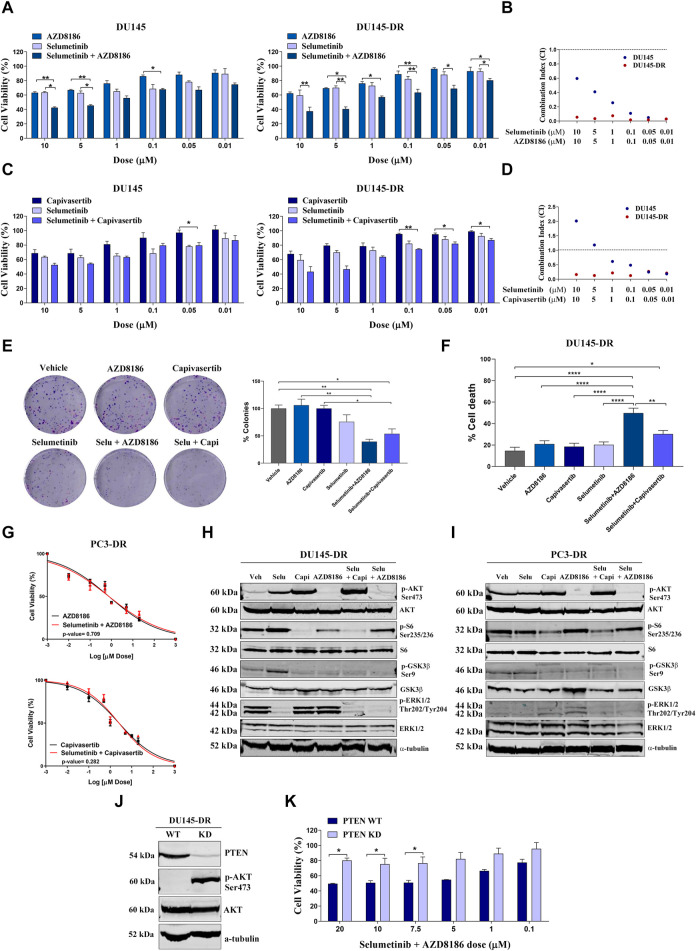
FIGURE 3.
Selumetinib+AZD8186 synergistically decrease cell viability and induces apoptosis in PTEN-wild-type (PTEN-wt) docetaxel-resistant metastatic castration-resistant prostate cancer cell lines. (A) Bar graphs representing mean ± SEM percentage of cell viability after 72-h treatment with AZD8186, selumetinib or selumetinib+AZD8186 at the indicated doses in the PTEN-wt DU145 and DU145-DR cells. p-values are relative to the indicated treatment. (B) Dot plot representing combination index (CI) values calculated for selumetinib+AZD8186 at the indicated doses in DU145 (blue dots) and DU145-DR (red dots) cells. (C) Bar graphs representing mean ± SEM percentage of cell viability after 72-h treatment with capivasertib, selumetinib or selumetinib + capivasertib at the indicated doses in the PTEN-wt DU145 and DU145-DR cells. p-values are relative to the indicated treatment. (D) Dot plot representing CI values calculated for selumetinib + capivasertib at the indicated doses in DU145 (blue dots) and DU145-DR (red dots) cells. (E) Representative colony formation images (left panel) and bar graph representing the percentage (mean ± SEM) of colonies (right panel) in DU145-DR cells after 72 h of the indicated treatments. p-values are relative to vehicle or the indicated treatment. (F) Bar graph representing the percentage (mean ± SEM) of late apoptotic cells after 120 h of 5 µM of the indicated treatments. p-values are relative to vehicle or the indicated treatment. (G) Dose response curves for PC3-DR cells after treatment with selumetinib + AZD8186 (upper panel) or selumetinib + capivasertib (lower panel) at 0-20 µM for 72 h (mean ± SEM). (H) Representative Western blot images showing protein expression changes of the indicated proteins in DU145-DR cells after 72 h of 5 µM of the indicated treatments. α-tubulin was used as endogenous control. (I) Representative Western blot images showing protein expression changes of the indicated proteins in PC3-DR cells after 72 h of 5 µM of the indicated treatments. α-tubulin was used as endogenous control. (J) Representative Western blot images showing protein expression changes of PTEN and p-AKT in DU145-DR cells after PTEN knockdown (KD) by CRISPR Cas9. α-tubulin was used as endogenous control. (K) Bar graph representing the percentage (mean ± SEM) of cell viability after 72-h treatment with selumetinib + AZD8186 at the indicated doses in PTEN-wt DU145-DR and PTEN KD DU145-DR cells. p-values are relative to PTEN-wt DU145-DR cells. All results shown were obtained from at least three independent biological replicates. p-values were calculated using a two-tailed Student’s t-test. *p ≤ 0.05; **p ≤ 0.01; ****p ≤0.0001.

