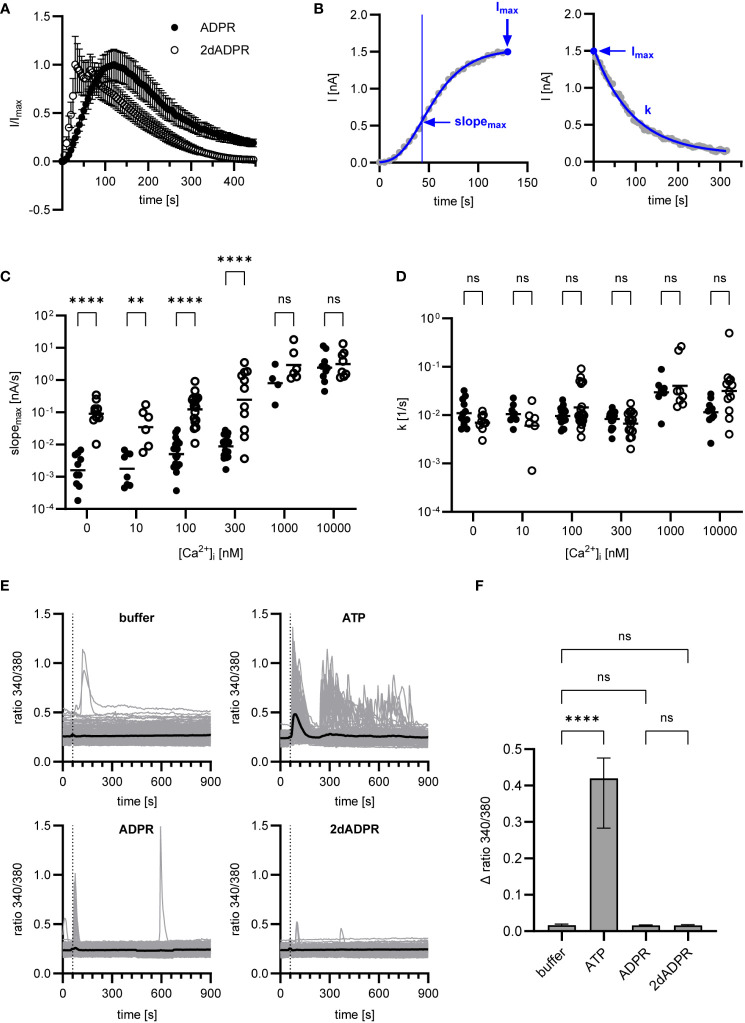
Figure 2.
Data of Figure 1 were analyzed regarding rates of activation and inactivation. (A) Time course of normalized whole-cell current over 445 s, exemplarily depicted for [Ca2+]i = 300 nM. Currents are given as means ± SEM. (B) Rate of activation was determined by fitting the Gompertz model to the development of current over time and calculating the maximum slope of the curve (slopemax). Rate of inactivation was determined by fitting the exponential decay model to the decline of current over time and employing the exponential decay constant (k). Determination exemplarily depicted for a single measurement at [Ca2+]i = 300 nM. Resulting rates of activation (C) and inactivation (D) for ADPR and 2dADPR. Data displayed log-normal distribution and were log-transformed to obtain normal distribution. They are presented on an anti-log scale. The bar denotes the mean. ns not significant, **p < 0.01, ****p < 0.0001 (multiple t test). (E) Ca2+ imaging experiments were performed with HEK293 cells stably expressing human TRPM2. 100 µM ATP/ADPR/2dADPR were extracellularly added 1 min after the start of the measurement (dashed line). Negative controls were left without addition (buffer). The bold line represents the mean Fura-2 fluorescence ratio of n=240 (buffer), n=173 (ATP), n=198 (ADPR) and n=166 (2dADPR) cells from 9-10 cell fields from 4 independent experiments. (F) The change in ratio from minimum to maximum within the first 2 min after addition was analyzed for each cell. Data displayed non-normal distribution. The bar denotes the median ± 95% CI. ns not significant, **** p < 0.0001 (Kruskal-Wallis test).

