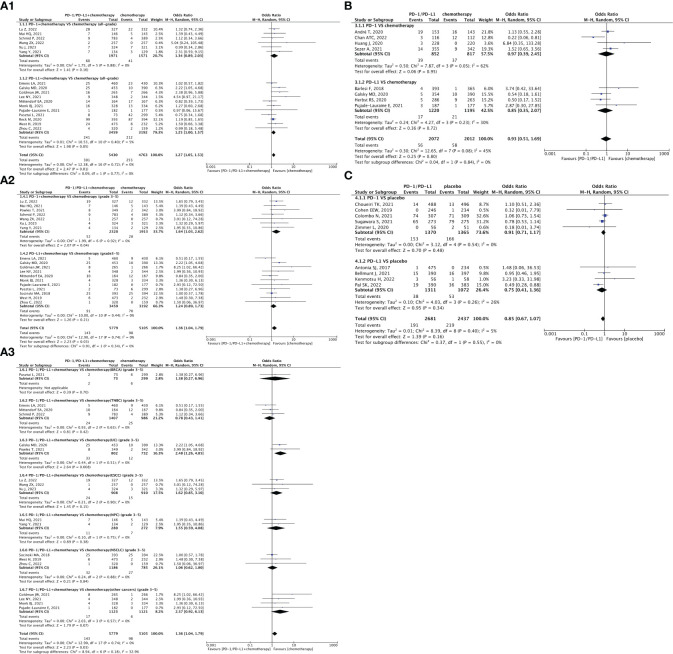
Figure 2.
Forest plots depicting the risk of hypertension in PD-1/PD-L1 + chemotherapy versus chemotherapy. (A1) The risk of hypertension of all-grade: subgroup analyses were conducted according to PD-1/PD-L1. (A2) The risk of hypertension of grade 3-5: subgroup analyses were performed based on PD-1/PD-L1. (A3) The risk of hypertension of grade 3-5: subgroup analyses were performed based on types of tumors. Forest plot depicting the risk of hypertension in PD-1/PD-L1 versus chemotherapy. (B) The risk of hypertension of all-grade: subgroup analysis was conducted according to PD-1/PD-L1. Forest plot depicting the risk of hypertension in PD-1/PD-L1 versus placebo. (C) The risk of hypertension of all-grade: subgroup analysis was conducted according to PD-1/PD-L1.

