Figure 5.
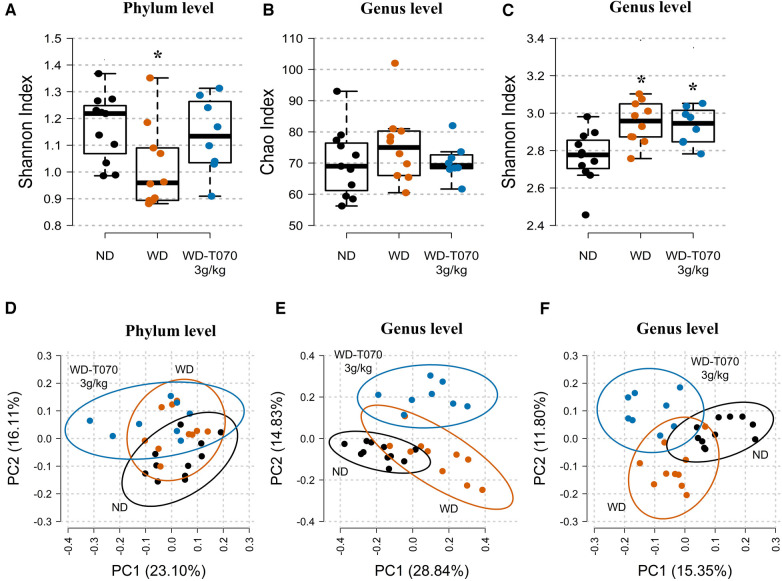
Effect of Totum-070 on richness, diversity and composition of fecal microbiota. (A) Shannon diversity index at the phylum level. (B) Rarefied Chao index (richness index) at the genus level. (C) Shannon diversity index at the genus level. (D) and (E) Principal coordinate analysis based on the Bray–Curtis dissimilarity index at the phylum and genus levels, with 95% confidence standard deviation ellipses. (F) Principal coordinate analysis based on the Jaccard dissimilarity index at the genus level, with 95% confidence standard deviation ellipses. Boxplots show the median, 25th and 75th percentile, and adjacent values. n = 11 ND, n = 10 WD, n = 8 WD-T070 3 g/kg. * p < 0.05 vs. ND.

