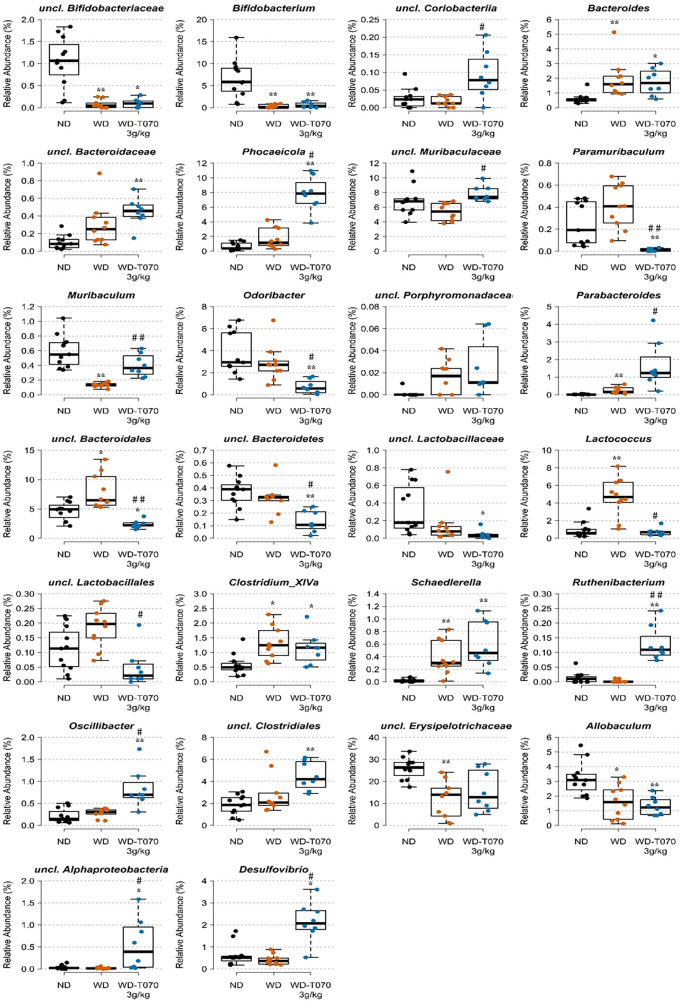
Figure 6.
Effect of Totum-070 on composition of fecal microbiota at the genus level. Figures represent relative abundance values of genera that differed significantly between two groups or more. Boxplots show the median, 25th and 75th percentile, and adjacent values. n = 11 ND, n = 10 WD, n = 8 WD-T070 3 g/kg. *p < 0.05, **p < 0.01, ***p < 0.001 and ****p < 0.0001 vs. ND. #p < 0.05, ##p < 0.01, ###p < 0.001 and ####p < 0.0001 Totum-070 (T070) group vs. WD.

