Figure 1.
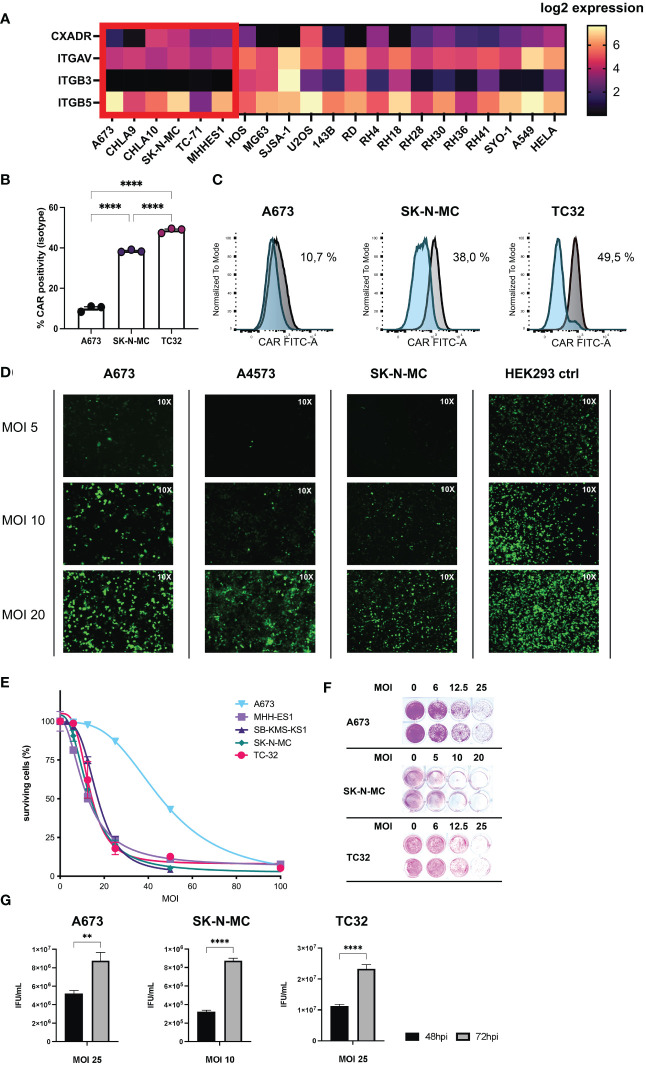
Ewing sarcoma (EwS) cell lines are susceptible to adenovirus (Ad) infection and XVir-N-31-infection induces tumor lysis and release of viral progeny. (A) Receptor expression in tumor cell lines associated with viral entry of XVir-N-31 (AdDelo3RGD). Log2 gene expression values of relevant receptors for interaction with Ad-RGD (CXADR, ITGAV, ITGB3, ITGB5), were extracted from DepMap Portal Cell Line Selector (Broad Institute: depmap.org) and visualized with the heatmap tool in Prism 9. EwS cell lines are marked in red; additional osteosarcoma and rhabdomyosarcoma cell lines as well as A549 and HELA are also shown for comparison. (B, C) FACS analysis of cognate Ad5 receptor (CAR, CXADR) surface expression on tumor cell lines (A673, SK-N-MC, TC32), examined with an anti-CAR-FITC antibody, and plotted as column bars of CAR-positive cells (minus isotype) in (B) and depicted as (C) histograms of the mean fluorescence intensity (normalized to mode) of CAR signal (grey) and isotype control (blue). (D) Multiplicity of infection (MOI)/dose-dependent increase of infectivity analyzed by immunofluorescence imagining (10x) of indicated EwS tumor cells and HEK293 control after virus infection with a GFP-expressing Ad-RGD. Photos were taken 48 hours post infection (hpi). (E, F) Cell survival assay of a selection of tumor cell lines after infection with XVir-N-31 at indicated MOI, analyzed 4-6 days post infection (dpi) with SRB staining and photometric extinction measurement. (G) Formation of viral progeny was assessed by hexon titer tests of EwS cell lysates 48hpi and 72hpi respective MOI and depicted as infectious units (IFU)/mL for 3 representative cell lines. Levels of significance are indicated as asterisks: * p < 0.05, ** p < 0.01, *** p < 0.005, **** p < 0.0001. Either unpaired student’s t-test or ordinary ANOVA with Tukey’s multiple comparison were used in Prism 9. Error bars show the SEM.

