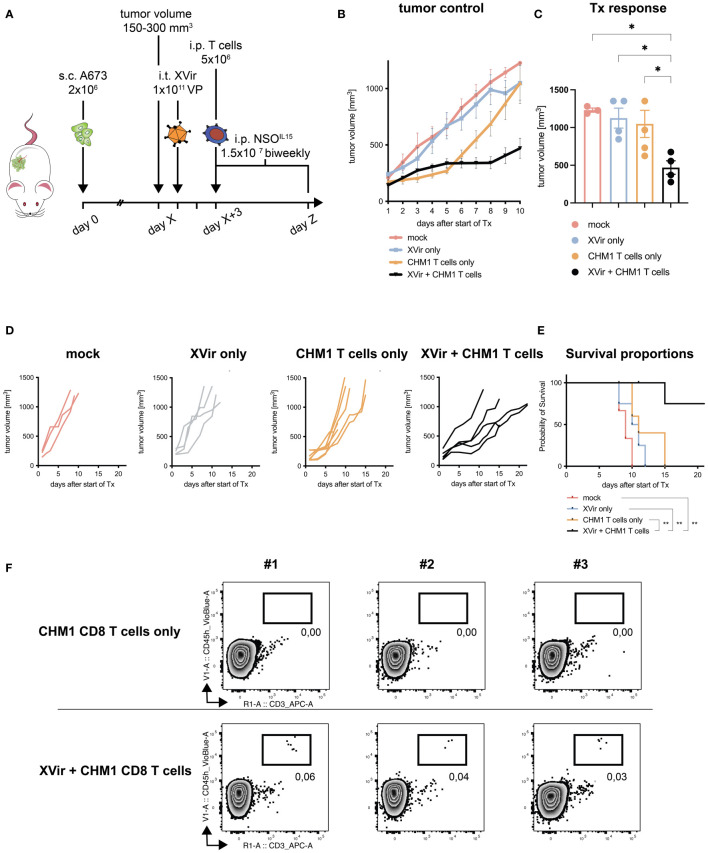
Figure 2.
Combination of CHM1319/HLA-A*02:01-restricted TCR-transgenic CD8+ T cells (CHM1 CD8 T cells) and XVir-N-31 increases therapy response and survival. (A) Experimental setup: 2x10⁶ A673 tumor cells were injected s.c. in the flank of Rag2-/-c-/- mice at day 0. When tumors reached a volume of 150-300 mm3 (day X), animals were randomized to treatment groups: mock, Xvir (XVir-N-31) only, CHM1 (CD8) T cells only, and XVir + CHM1 T cells. Then, 1x10¹¹ viral particles (VP) of XVir-N-31 or PBS were injected i.t. at day X+1. 2 days later (day X+3), 5x10⁶ purified CHM1 T cells (validated by flow cytometry before administration, data not shown) were administered i.p. combined with 1.5x10⁷ IL-15-producing NSO cells i.p. (previously irradiated with 100 Gray). NSO application was repeated biweekly until the end of experiment (defined by tumor volume 1000 mm3). Tumor control in treatment groups is plotted as mean tumor growth until 10 days after start of therapy (Tx) in (B) and for each animal per group until the end of experiment in (D); mock n=3, XVir only n=4, CHM1 T cells only n=5, and XVir + CHM1 T cells n=5. For B, imputed values were added to draw the tumor volume growth curve, assuming linear increase of tumor volume. (C) Response to Tx was analyzed on day 8-10 after start of Tx, using the maximum tumor volume per animal. Statistical analyses were performed in Prism 9 using the multiple comparison tool in combination with ordinary one-way ANOVA. (E) Kaplan-Meier survival curves were generated with Prism 9 from all animals the Mantel-Cox log-rank test. If animals did not reach the endpoint criteria tumor volume 1000 mm3, they were censored. (F) Percentage of tumor-infiltrating T cells (TILs, i.e. CHM1 T cells) in explanted tumors (in relation to all gated cells, after live-dead-cell exclusion with Viobility Dye) was evaluated at the end of experiment from 3 representative animals per group (CHM1 T cells only and XVir + CHM1 T cells) via flow cytometry using anti-human CD45-VioBlue and anti-human CD3-APC antibodies. Significance is indicated as asterisks: * p < 0.05, ** p < 0.01. Error bars indicate the SEM.

