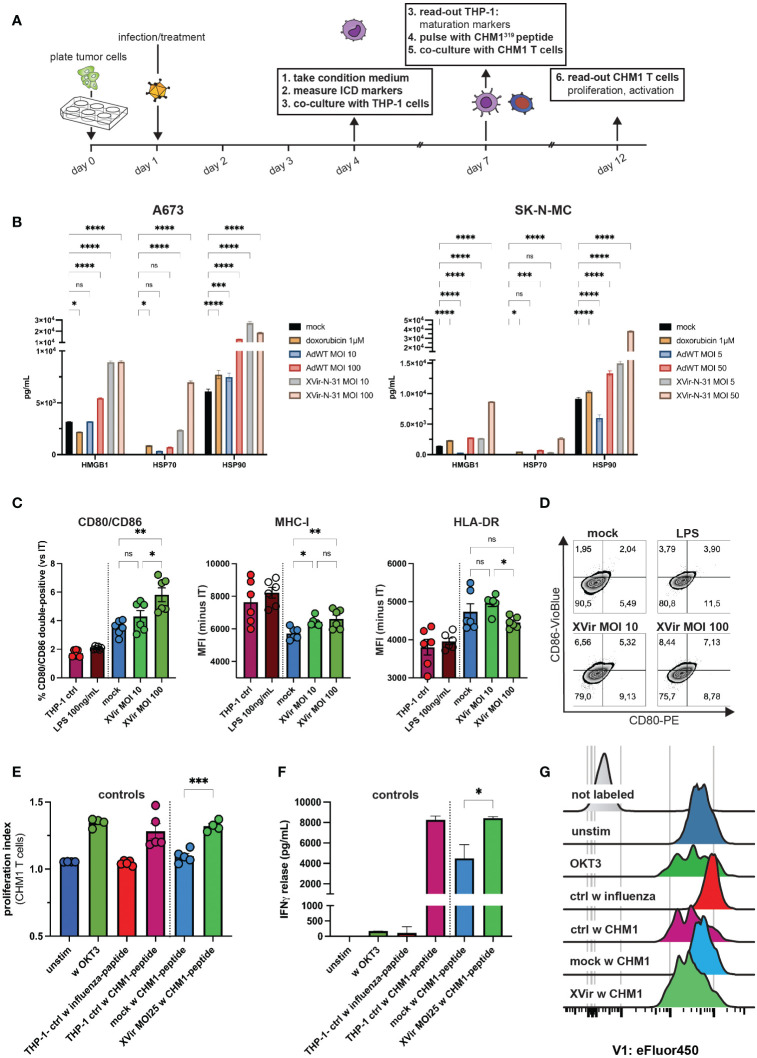
Figure 4.
XVir-N-31 induces release of markers of an immunogenic cell death, upregulates maturation markers on antigen-presenting cells and stimulates antigen-specific T cell proliferation. (A) Experimental setup: tumor cells were plated in 6-well-plates. The day after, infection with XVir-N-31 or adenovirus wildtype (AdWT) was performed at indicated MOI or cells were treated with doxorubicin (1M). At day 4 (i.e. 72h post infection, hpi), tumor-conditioned medium (CM) was harvested and (B) markers of immunogenic cell death HMGB1, HSP70, and HSP90 were assessed via the luminex 200 system. Then, THP-1 cells were cultured in CM for 72h (until day 7) and maturation markers were assessed via flow cytometry (C, D). Indicated MOI of XVir-N-31 was used in (C). THP-1 controls are as described in (E). (E–G) T cell proliferation and activation were analyzed 5 days after start of coculture (day 12) after T cell labelling with eFluor450. Control THP-1 cells were cultured in either standard medium or LPS was added to cells in standard medium (positive control). Furthermore, T cells were either not stimulated, or stimulated with OKT3 (50ng/mL). After dead cell exclusion with propidium iodine (PI), singlet exclusion, analysis of surface markers in (C) or proliferation (eFluor450) and was performed and release of IFNγ was detected. Antigen specific T cell gating strategy is provided in Supplementary Figure 4. Conditions included: unstim = unstimulated T cells only, w OKT3 = only OKT3 50 ng/mL as control, THP-1 ctrl w influenza/CHM1-peptide = THP-1 cell cultured in standard medium and pulsed with influenza-control or CHM1-peptide, mock and XVir MOI25 w CHM1-peptide. Statistical analysis was performed with Tukey’s multiple comparison combined with ordinary one-way ANOVA in (C) and for statistics in (E, F), unpaired student’s t-test was used. Results of two independent experiments were pooled and shown in (C, E). Here, each dot represents one biological replicate. Experiments in (F) were performed in triplicates. (.) Representative proliferation peaks of T cells are shown as histograms. Significance levels are indicated as asterisks: * p < 0.05, ** p < 0.01, p*** < 0.005, ****p < 0.0001, ns = not significant. Error bars indicate the SEM.

