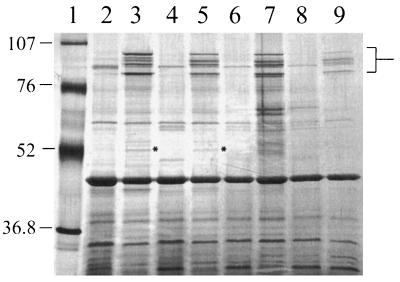
FIG. 2.
Induction of FeRPs by Fe starvation of B. avium. Lanes: 1, molecular mass standards; 2, 4169 in Chelex-treated CDM–36 μM FeSO4; 3, 4169 in Chelex-treated CDM; 4, 4169 in BHI; 5, 4169 in BHI–100 μM EDDA; 6, 838 in BHI; 7, 838 in BHI–100 μM EDDA; 8, 75 in BHI; 9, 75 in BHI–100 μM EDDA. The location of the 84-, 91.5-, 92-, and 95-kDa FeRPs is marked in brackets. The 51-kDa FeRP, which is evident only in lanes 3 and 5, is marked with asterisks. Lanes 2 to 9 each contain 1 μg of total protein. Molecular masses are in kilodaltons. The gel was stained with silver.

