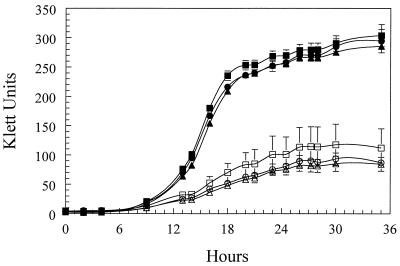
FIG. 4.
Growth of 4169 and the transposon mutants Pho-6 and Pho-20. ○, 4169 in Chelex-treated CDM; •, 4169 in Chelex-treated CDM–36 μM FeSO4; □, Pho-6 in Chelex-treated CDM; ■, Pho-6 in Chelex-treated CDM–36 μM FeSO4; ◊, Pho-20 in Chelex-treated CDM; ⧫, Pho-20 in Chelex-treated CDM–36 μM FeSO4. Each point represents the mean culture density obtained from three independent cultures. The error bars represent 1 standard deviation of the mean.

