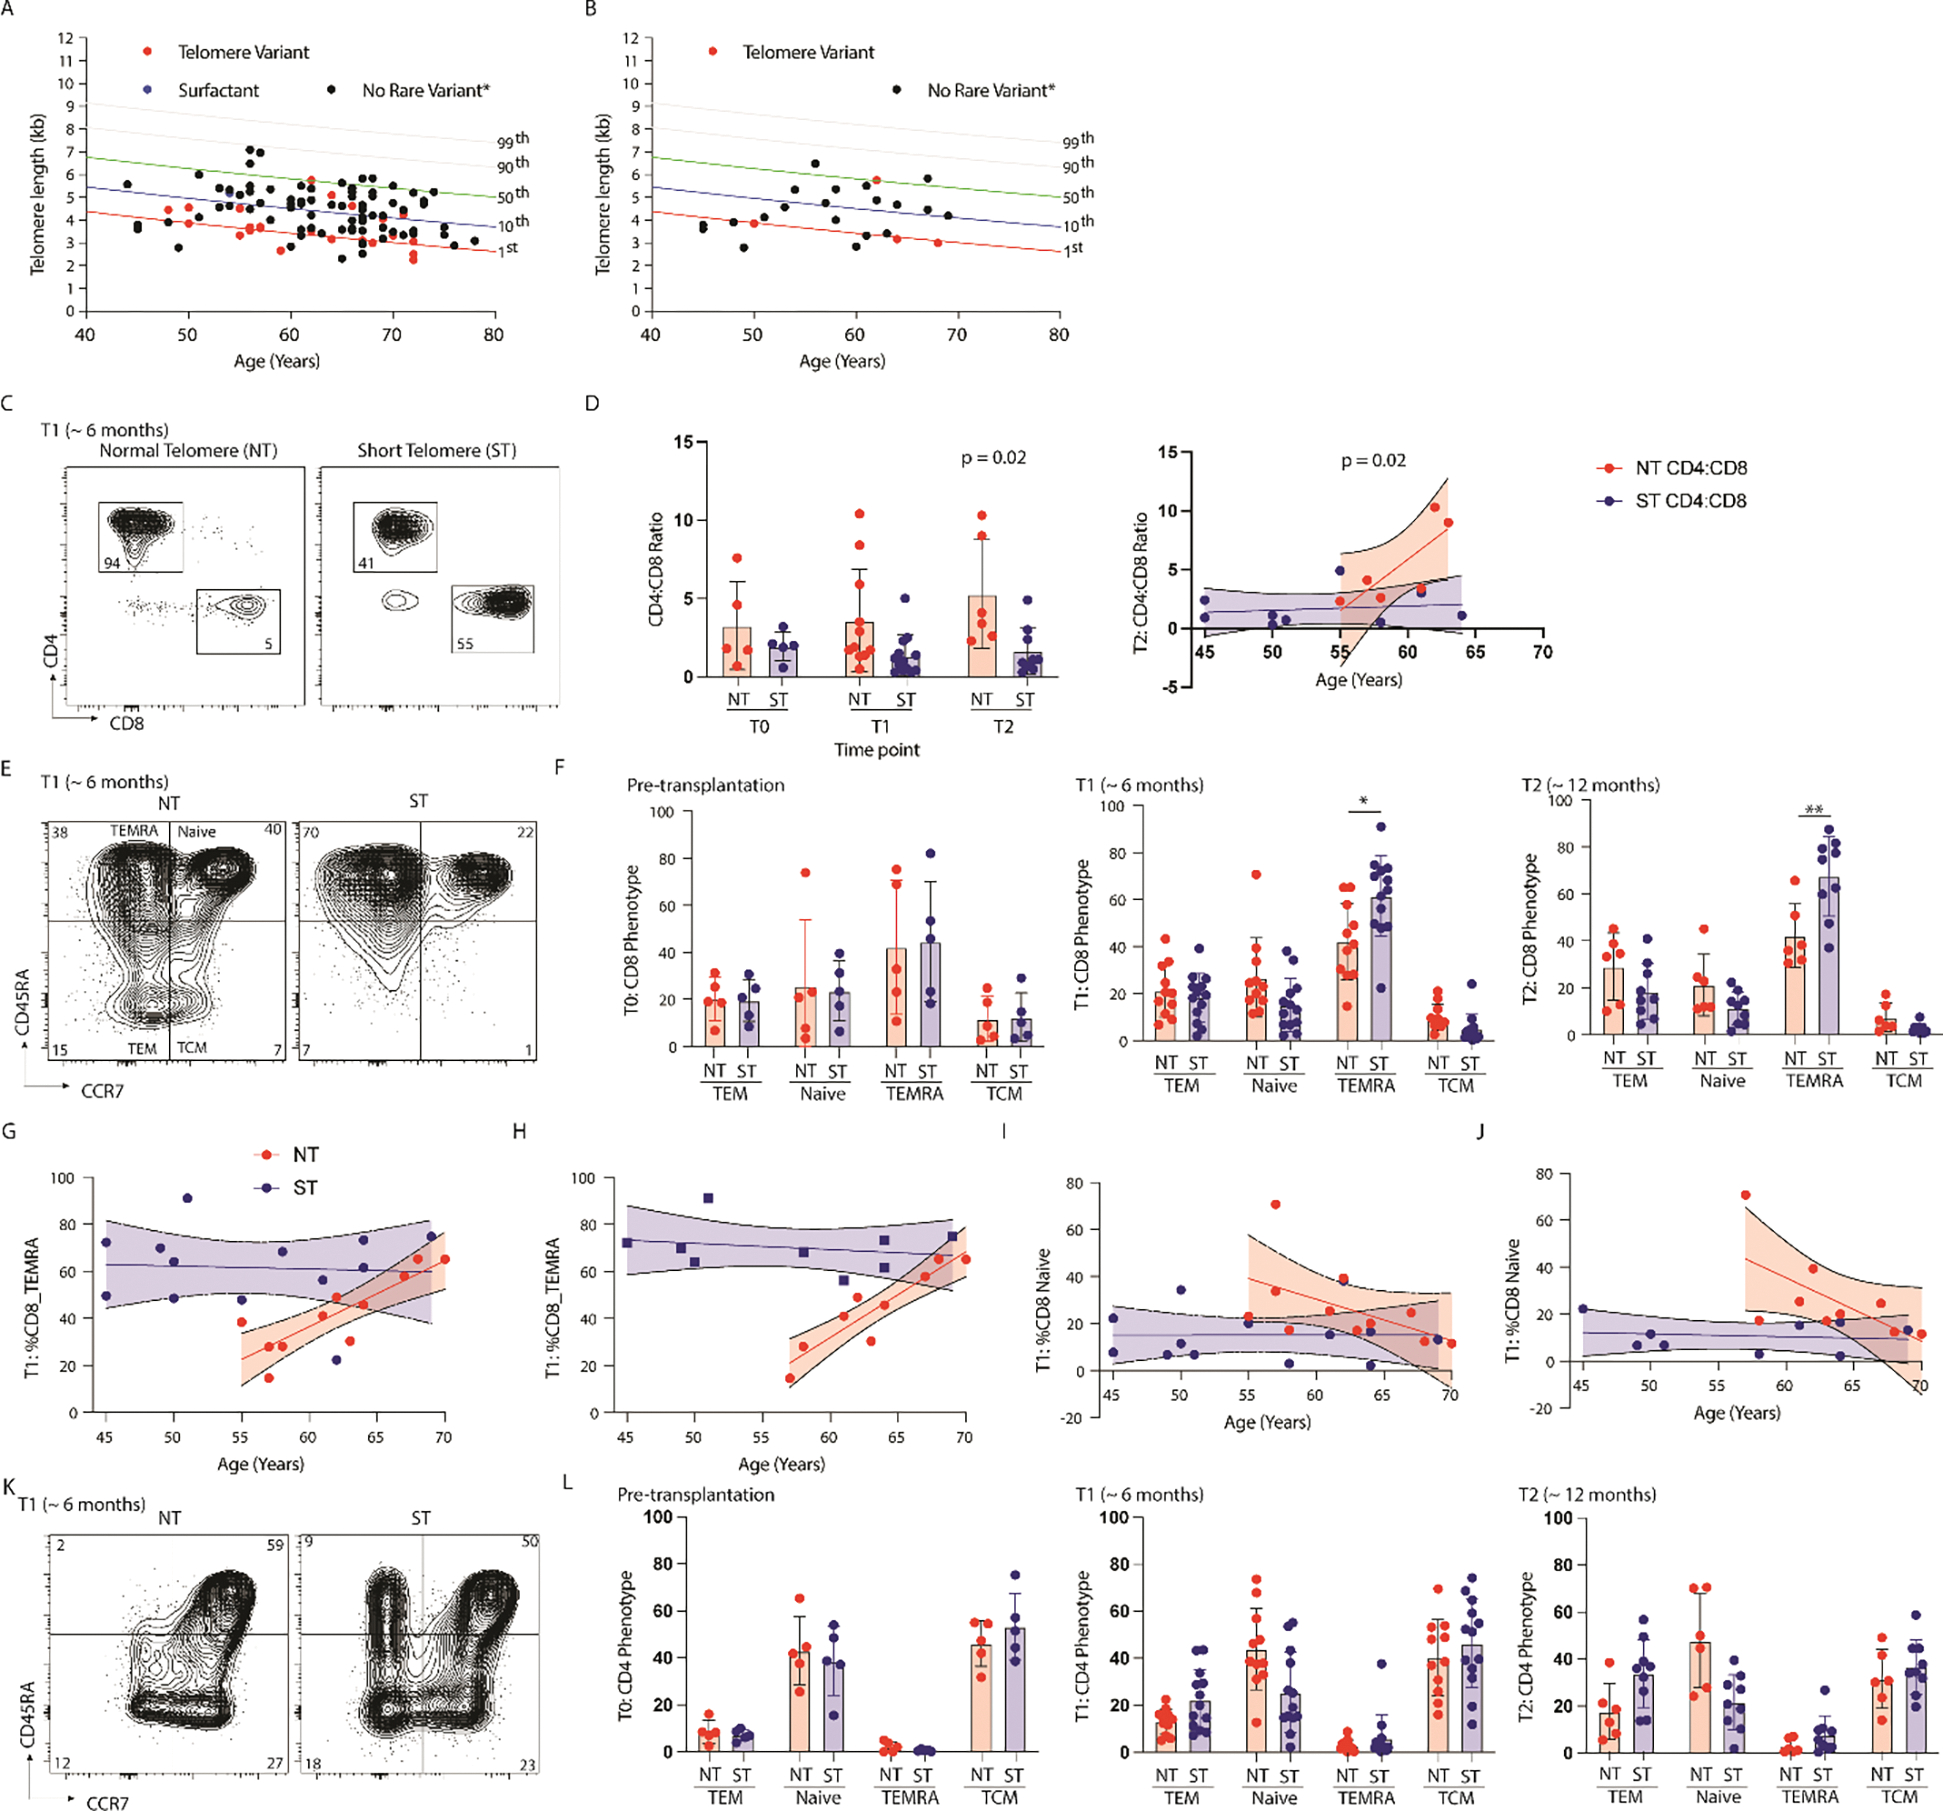
Figure 1: Premature ‘aging’ of the circulating T cell compartment with ST.

(A,B) Scatterplot of lymphocyte telomere length by flowFISH and age of lung transplant recipient for (A) the entire cohort and (B) the subset cohort, lines represent percentile of length. (C) Representative flow cytometry plot isolating CD4+ and CD8+ T cells from the circulation of lung transplant recipients with short telomere length (ST) or normal telomere length (NT) at 6 months post transplantation. (D, Left) Cumulative data of circulating CD4:CD8 ratio between study populations at Time 0 (pre-transplant), Time 1(6 months), and Time 2 (12 months) by telomere length (NT = Normal telomere, ST = Short telomere), (N = 24 at T1, ** = p < 0.002) and (D, Right) CD4:CD8 ratio by age and telomere length at T2 (N = 14, p = 0.02 for testing difference between slopes). (E) Representative flow cytometry plot showing CD8+ T cell phenotype based on CD45RA and CCR7 expression (TEM = effector memory T cell defined as CD45RA−CCR7−, TEMRA = terminally differentiated effector memory T cell defined as CD45RA+CCR7-, Naïve cell defined as CD45RA+CCR7+, and TCM = central memory T cell defined as CD45RA−CCR7+). (F) Cumulative data showing circulating CD8+ T cell phenotype by telomere length at pre-transplantation (left, N = 10, no statistically significant difference), at ~ 6 months (T1, middle, N = 24, *p=001 for Mann-Whitney), and at ~ 12 months (T2, right, N = 14, **p =0.008 for Mann-Whitney). (G) Scatterplot showing relationship of age at transplantation, telomere length (NT = red, ST = blue), and the proportion of TEMRA of all CD8+ T cells at 6 months (N=24, NT: p =0.001 for non-zero, p = 0.01 for different slopes). (H) Scatterplot showing relationship of age at transplantation, telomere length (NT = red, ST = blue), and the proportion of TEMRA of circulating CD8+ T cells from those patients on 3 or more immunosuppressants at 6 months (N=18, NT: p =0.0004 for non-zero, p = 0.0003 for different slopes). (I) Scatterplot showing relationship of age at transplantation, telomere length (NT = red, ST = blue), and the proportion of Naive CD8+ T cells at 6 months (N=24, no statistically significant difference in slopes, and not-different than zero). (J) Scatterplot showing relationship of age at transplantation, telomere length (NT = red, ST = blue), and the proportion of Naive circulating CD8+ T cells from those patients on 3 or more immunosuppressants at 6 months (N=18, p =0.03 for difference in slopes). (K)Representative flow cytometry plot of circulating CD4+ T cell phenotype by telomere length. (L) Cumulative data showing CD4+ T cell phenotype by telomere length pre-transplantation (left, N=10), at 6 months (middle, N = 24, *p<0.05), and 12 months (right, *p<0.05) after transplantation. Statistical significance for all comparisons tested using Wilcoxon Rank Sum (Whitney Mann U).
