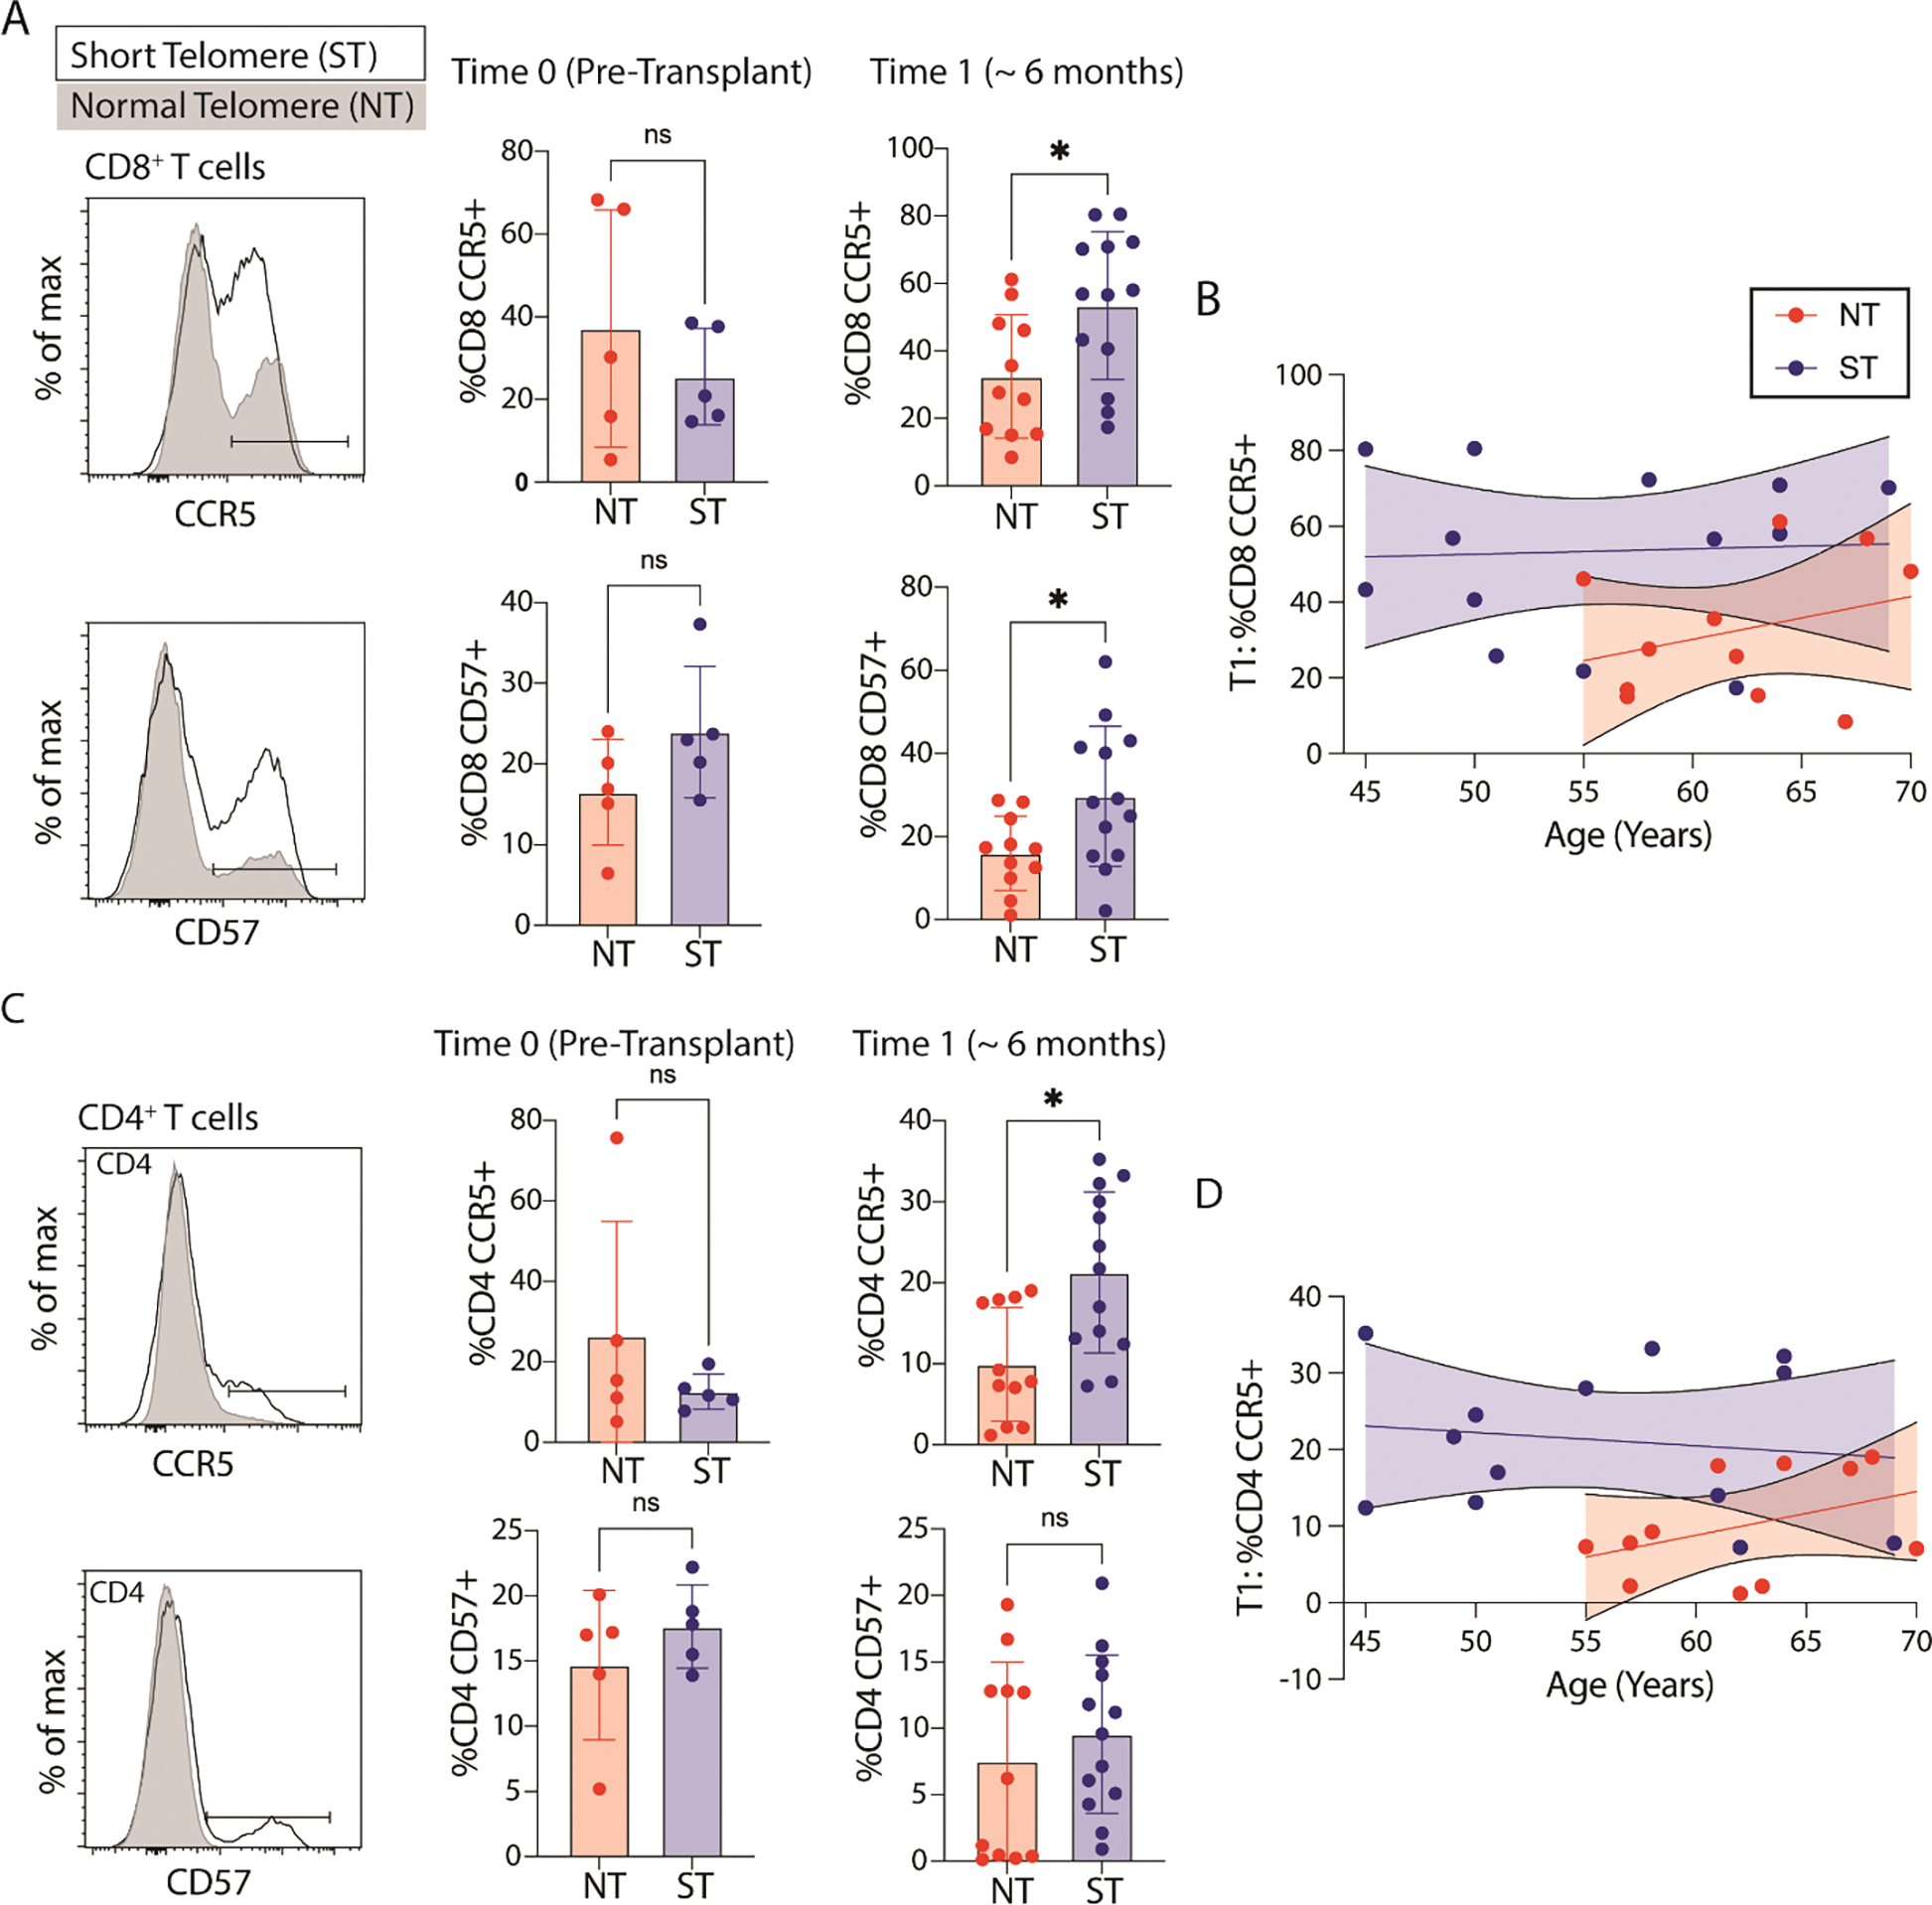
Figure 2: Circulating T cell exhaustion markers.

Representative flow cytometry histogram for markers of (A) CD8+ and (B) CD4+ T cell migration (chemokine receptor 5, CCR5), exhaustion (CD57) based on telomere length (ST = short telomere length, NT = normal telomere length) both pre-transplantation (N = 10) and at 6 months after transplantation (N = 24, * p value < 05). Statistical significance for all comparisons tested using Wilcoxon Rank Sum (Whitney Mann U). To the far right is the relationship between age, and CCR5 expression for CD8+ and CD4+ T cells at 6 month timepoint (N=24, p = 0.02 for difference in elevations for CD8, p = 0.01 for difference in elevations for CD4).
