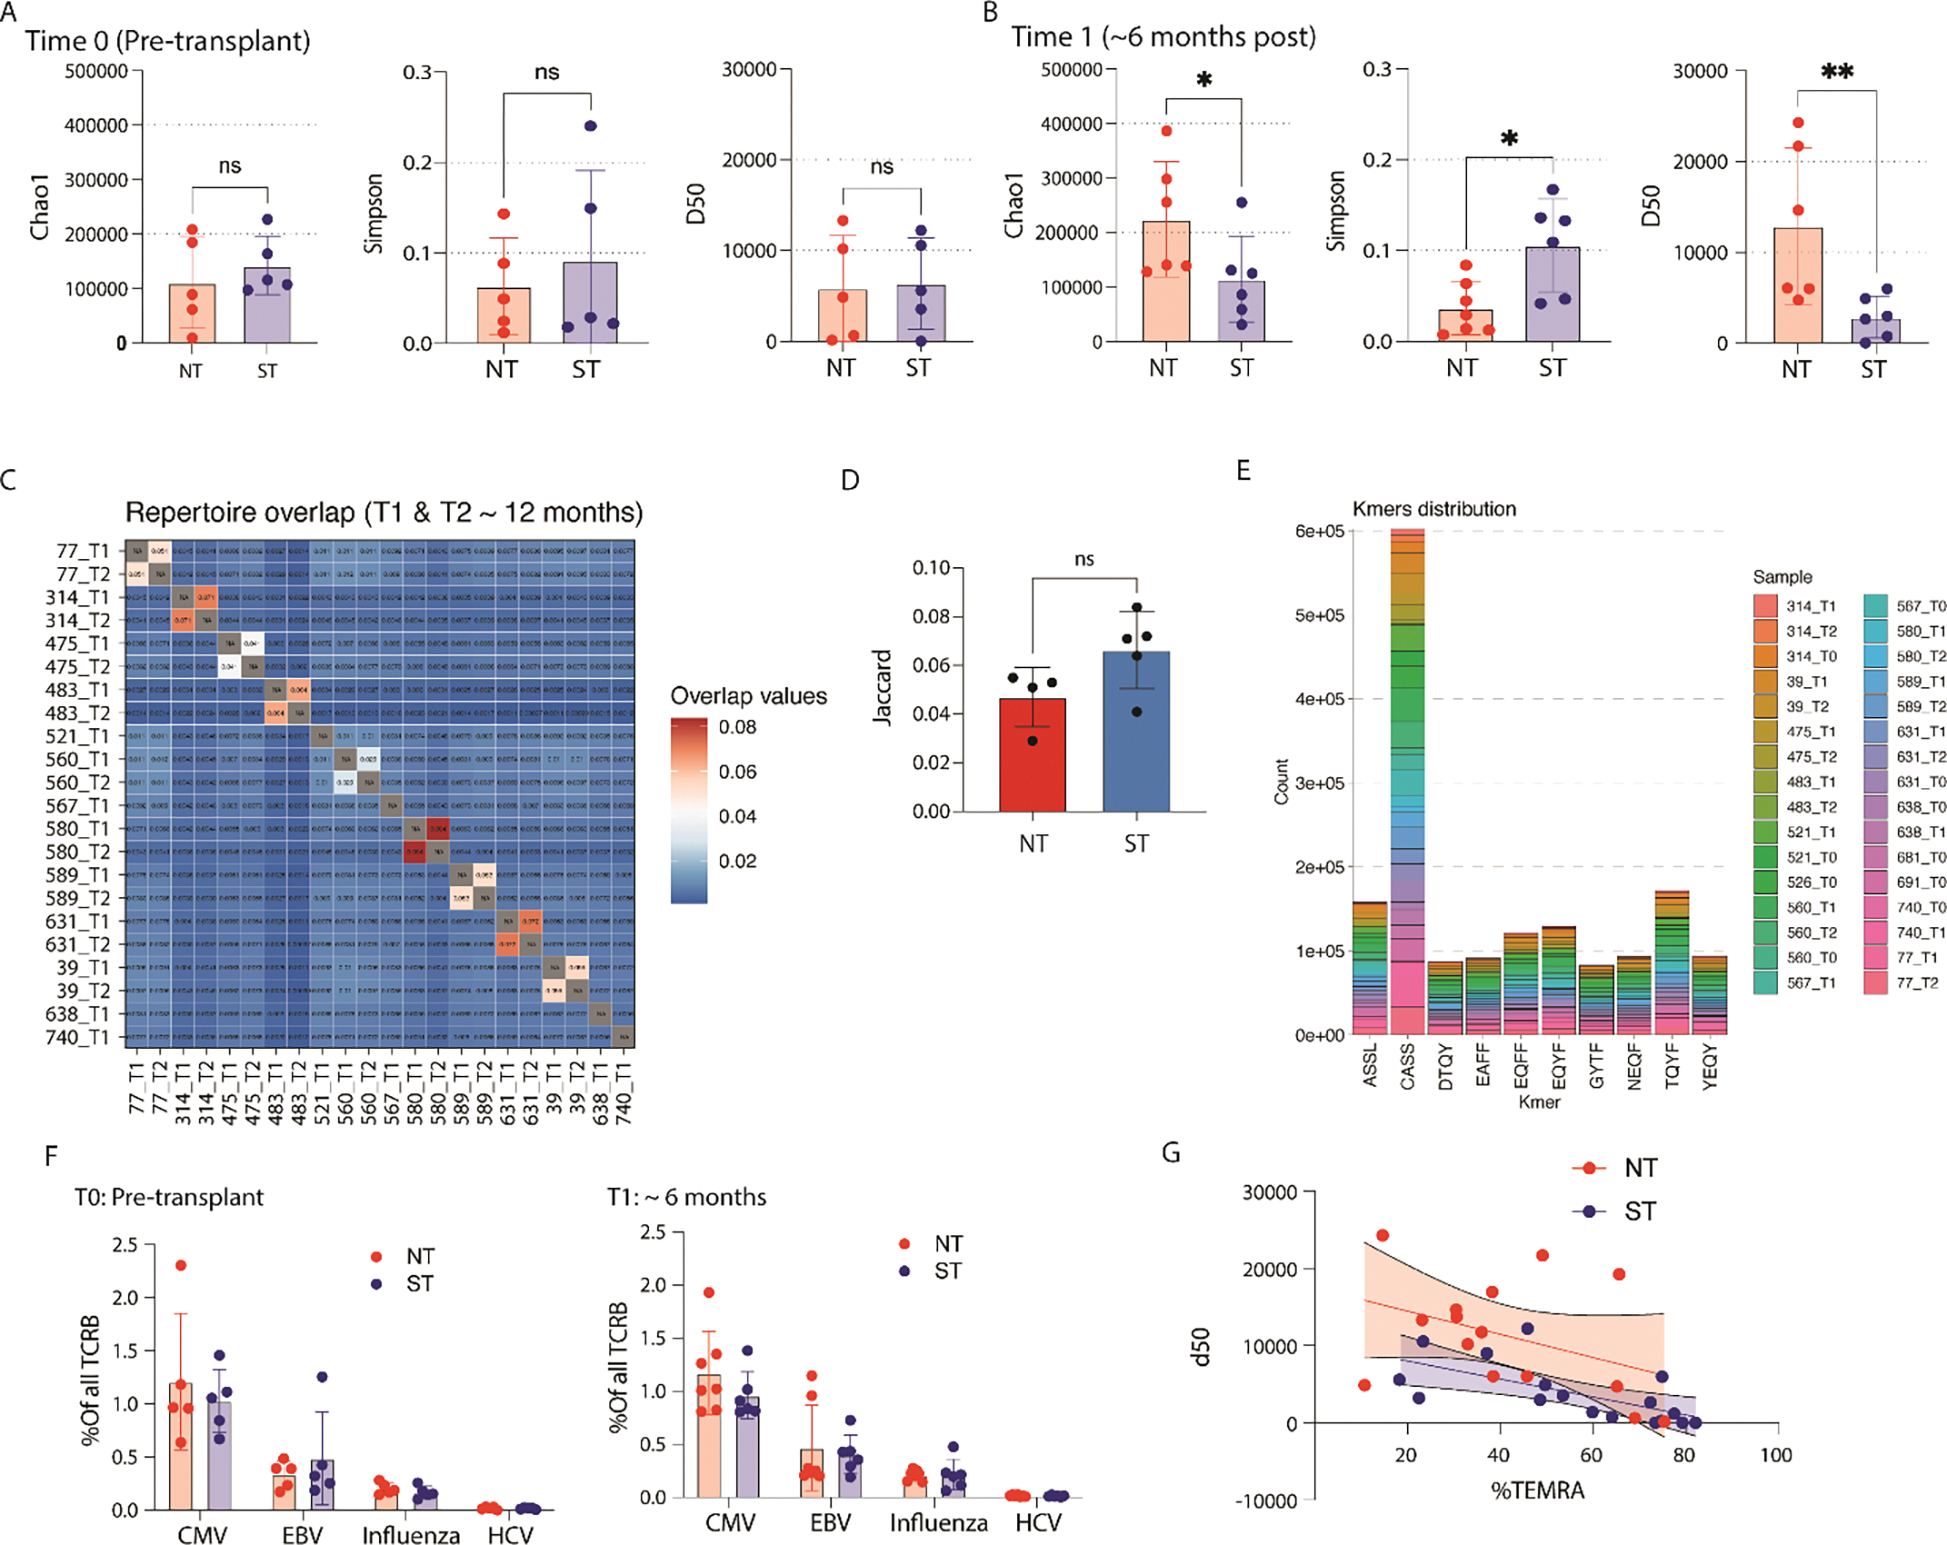
Figure 3. Circulating T cell receptor repertoire.

(A) Chao1, Simpson, and D50 diversity estimates for T cell receptor repertoire (TCR) from genomic DNA obtained from FAC-sorted T cells pre transplantation (N = 10, ns = no statistically significant difference). (B) Same TCR diversity estimates for cells obtained at the 6-month timepoint (N=12, *p<0.05, **p<0.01). (C) Jaccard index displaying clonal overlap between different samples; increased shared clones results in higher score. (D) Comparison of Jaccard index between normal and short telomere length comparing T1 with T2. (E) Top 10 4-mers identified from the hypervariable region of the TCR. (F) Comparison of viral specific TCR specificity between NT and ST (left) pre-transplantation, and (right) at 6 months after transplantation; specificity determined by querying VDJdb. (G) Relationship between clonal expansion (D50 = the number of unique clones required to take up 50% of total clonal repertoire), telomere length, and the proportion of TEMRA of all CD8+ T cells.
