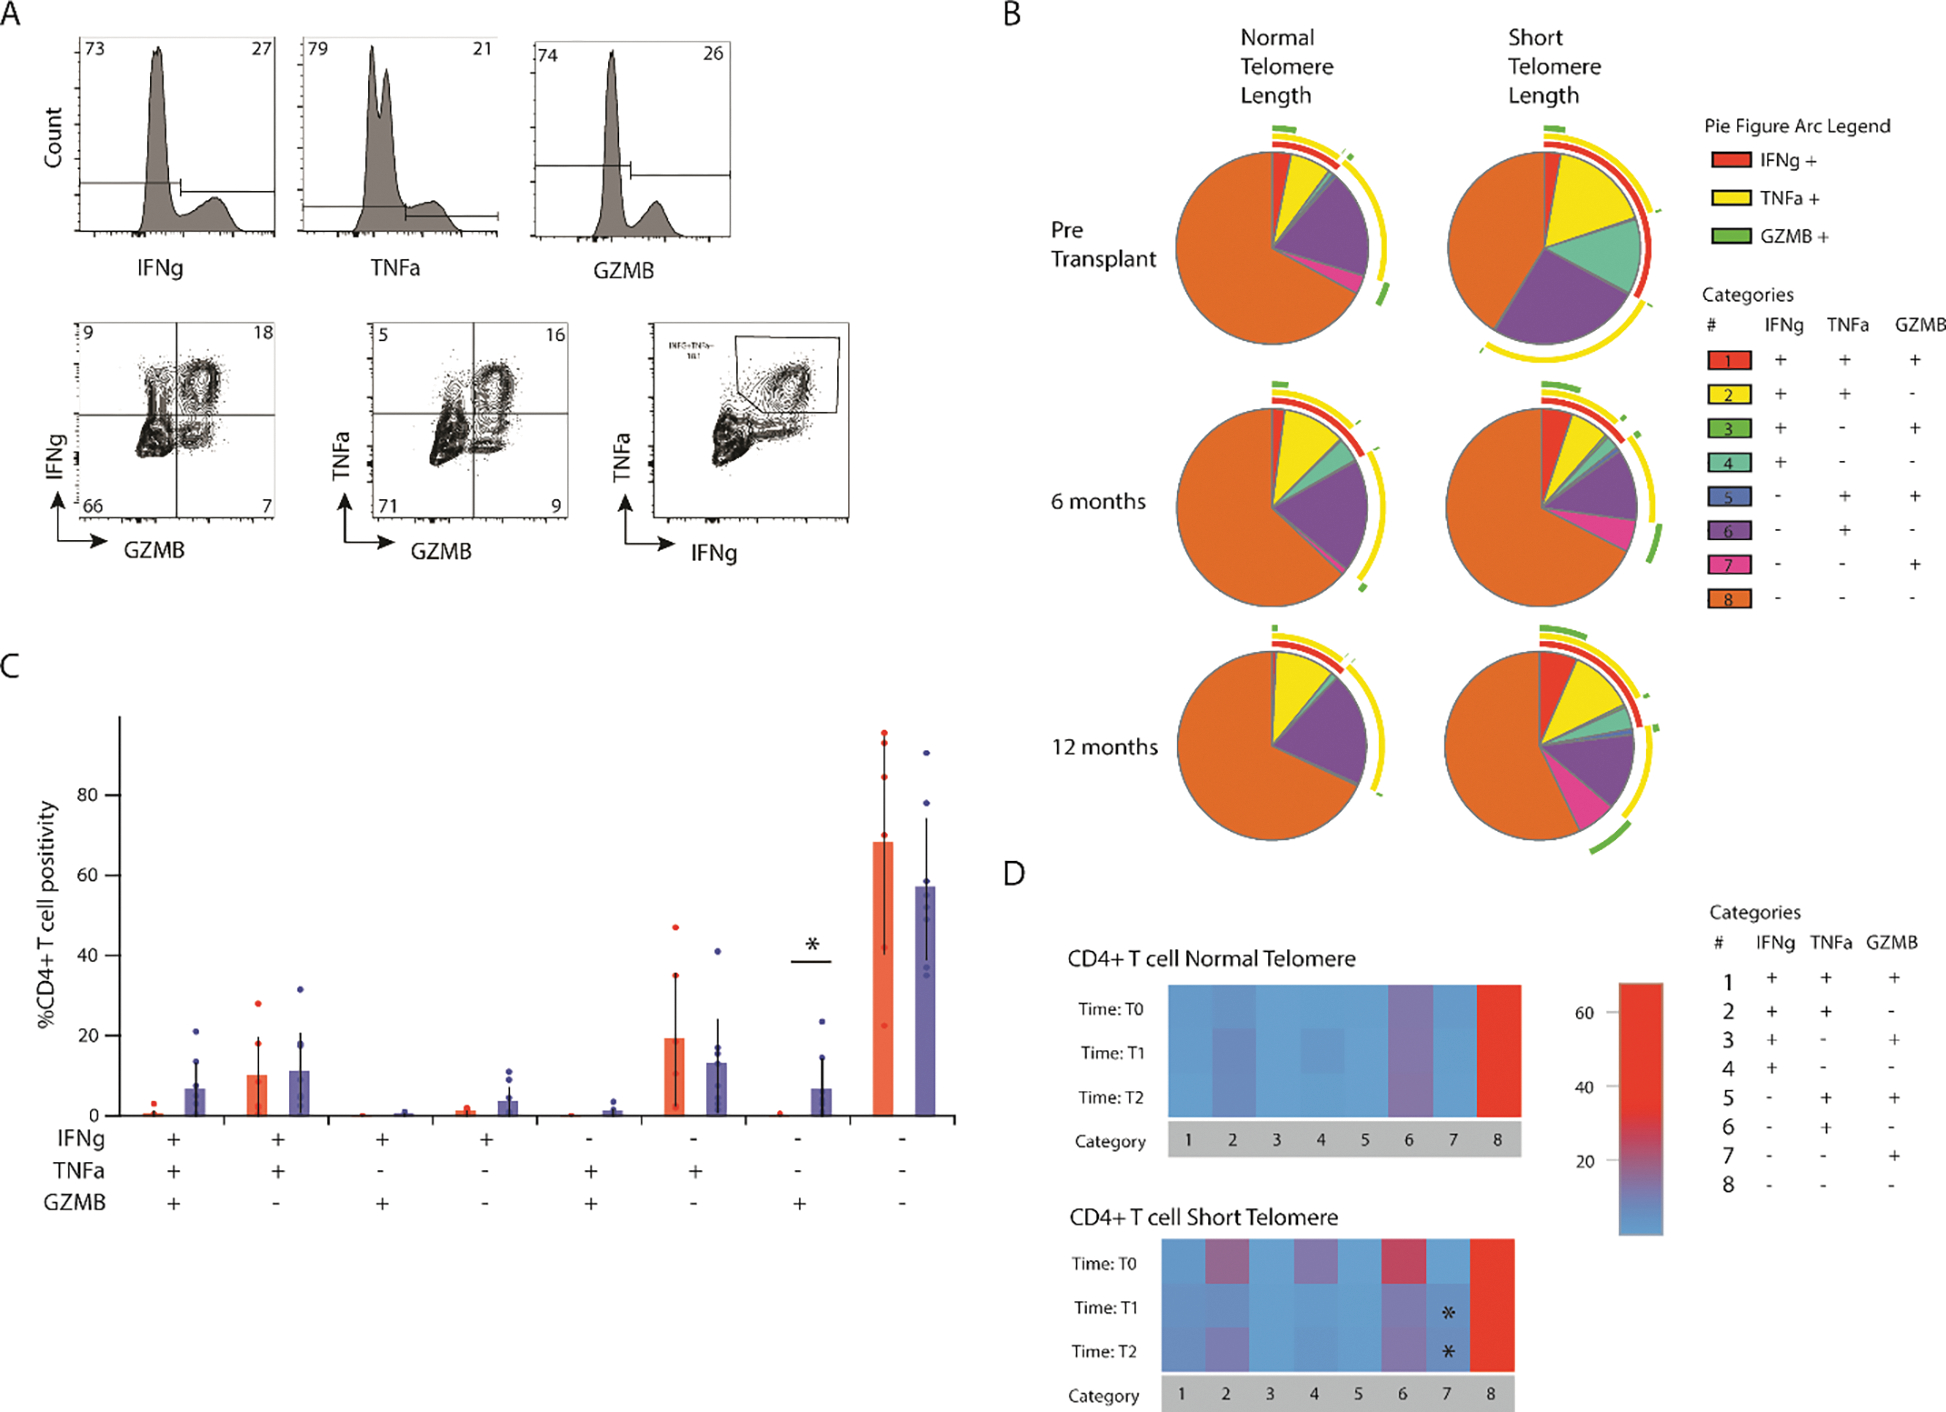
Figure 5. CD4+Granzyme B+ T cells in those with ST.

(A) Representative flow cytometry plot showing interferon gamma (IFNγ), tumor necrosis factor alpha (TNFα), and granzyme B (top) as well as co-expression (bottom). (B) Individual pie charts for CD4+ T cells from NT and ST at T0, T1, and T2 showing multifunctional responses of IFNg, TNFA, Granzyme B, and perforin; figure arcs surrounding pie chart display expression of each cytokine across pie chart. (C) Direct comparison of multifunctional response based on telomere length (*p<0.05). (D) Heatmap showing changes in multifunctional response over time, T1 and T2 are compared to T0 (*p<0.05).
