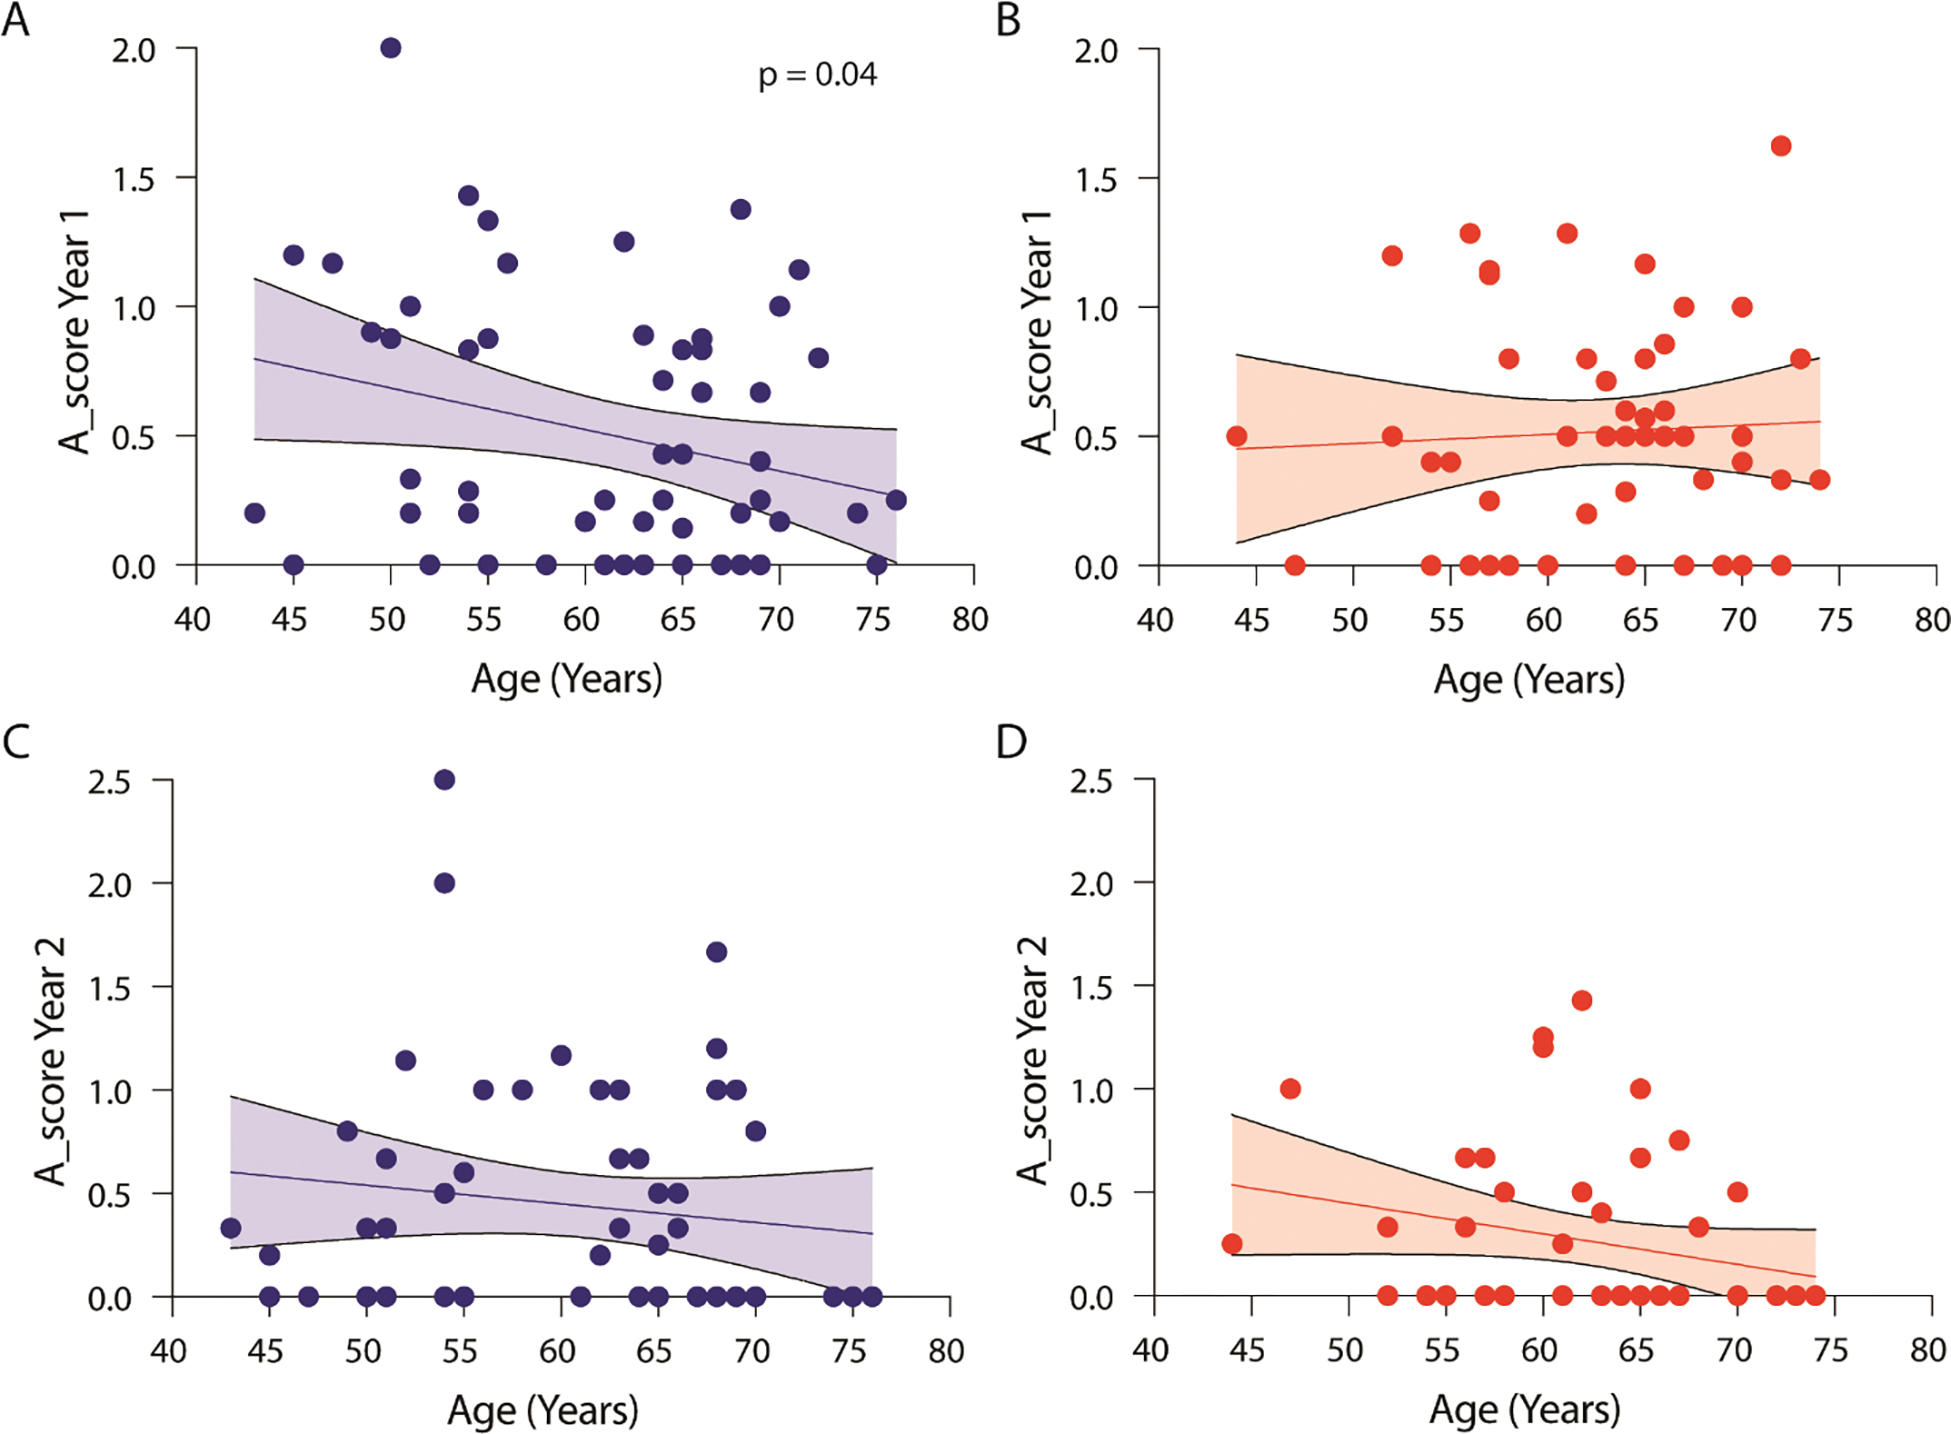
Figure 6. Age-dependent relationship between ST and ACR burden.

(A-D) Scatter plot showing linear regression with 95% confidence interval for the relationship between age and (A) early ACR score for those with ST (N=57, p<0.05), (B) early ACR score for those with NT (N=49, not statistically significantly deviated from zero), (C) late ACR score for those with ST (N= 55, not statistically significantly deviated from zero), and (D) late ACR score for those with NT (N=46, not statistically significantly deviated from zero).
