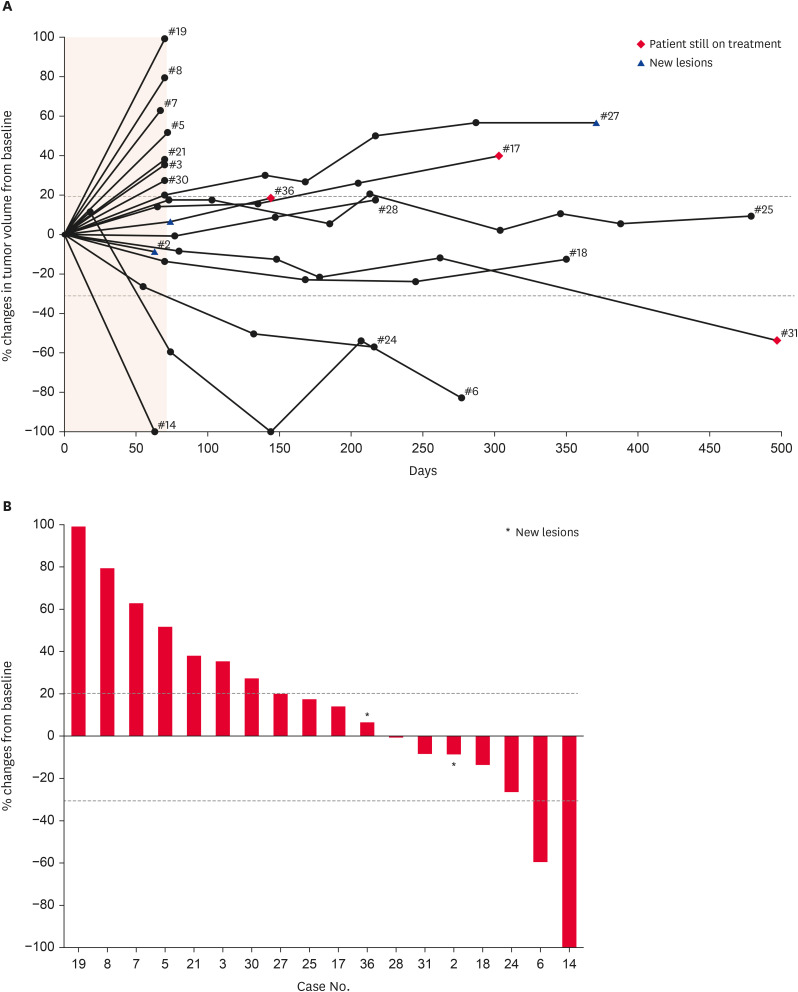
Fig. 2. Tumor response of ca-4F12-E6 in dogs with target tumor lesions (n = 19). (A) Percent changes of individual tumor volume of target lesions over time from baseline. The shaded lesion indicates the endpoint of the first treatment cycle. Dashed lines correspond to a 30% decrease and a 20% increase in tumor volume. The end of the line indicates the termination of this trial. (B) Percentage changes in the size of the target lesion from baseline at the endpoint of the first treatment cycle are indicated by a waterfall plot.
Asterisks indicate new lesions.

