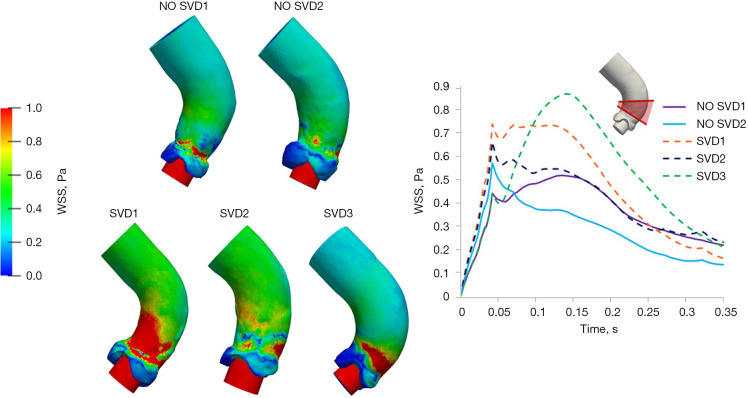
Figure 5.
WSS on the aortic wall of patients with TAVI (93): WSS distribution at systolic peak (left) and time evolution of average WSS in the orange area (right). High intensity and long persistence of WSS are predictive indicators of SVD. WSS, wall shear stress; TAVI, transcatheter aortic valve implantation; SVD, structural valve degeneration. Credits: R. Polidori, F. Renzi.

