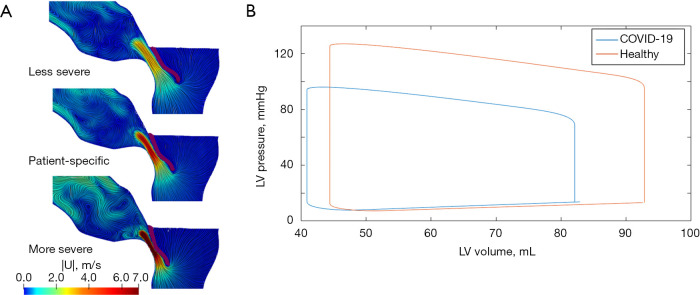
Figure 6.
Virtual scenario analyses: (A) 2D slices of the peak-systole blood velocity field in the left ventricle outflow tract of a patient with different levels of SAM (59); (B) pressure-volume loops of the LV of a healthy child and of a child with COVID-19 infection (94). SAM, systolic anterior motion; LV, left ventricle. Credits: L. Ruffino, A. Santoro, S. Sparvieri.

