Figure 6.

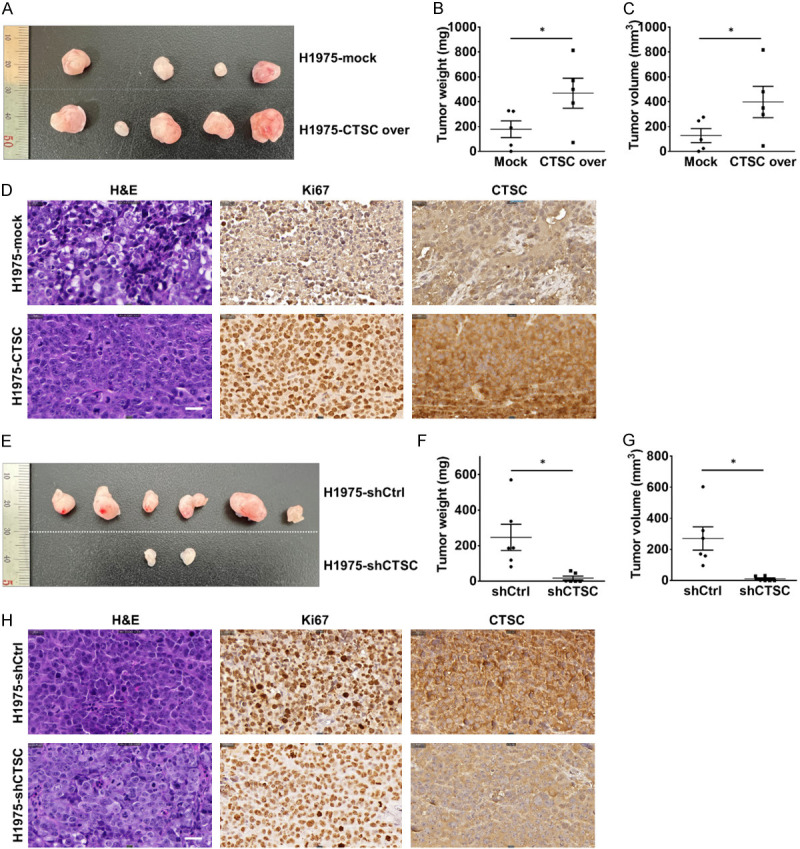
CTSC affects tumorigenesis in NSCLC in vivo. A. H1975-mock and H1975-CTSC cells are subcutaneously injected into both flanks of BALB/c nude mice (n = 5). Representative images showing the tumor-bearing mice and sizes of tumors injected with H1975-mock and H1975-CTSC cells at 18 days. Representative images of the removed tumors. B, C. Tumor growth is significantly increased in the CTSC overexpression group. D. Representative images of H&E, Ki-67, and CTSC staining. Magnification: × 400. E. H1975-shCtrl and H1975-shCTSC cells are subcutaneously injected into both flanks of BALB/c nude mice (n = 5). Representative images showing the tumor-bearing mice and sizes of tumors injected with H1975-shCtrl and H1975-shCTSC cells at 20 days. Representative images of the removed tumors. F, G. Tumor weight and volume are evaluated after dissecting tumors from the mice in each group. Tumor growth is significantly impaired in the CTSC knockdown group. H. Representative images of H&E, Ki-67, and CTSC staining. Magnification: × 400. Scale bar, 50 μm. *P < 0.1.
