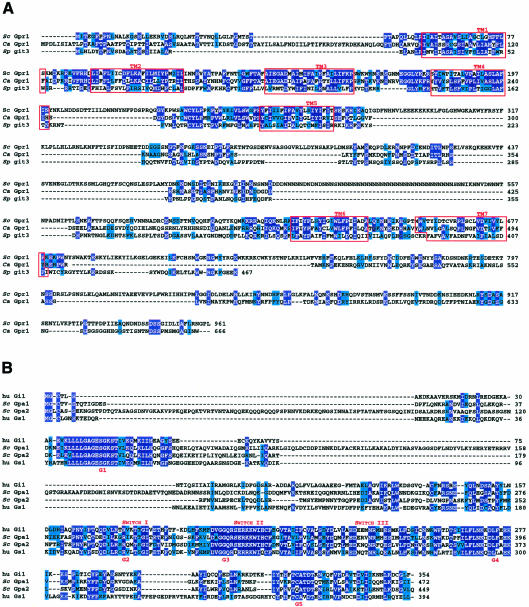
Fig. 2. (A) Alignment of putative glucose-sensing G-protein coupled receptors: S. cerevisiae Gpr1, C. albicans Gpr1 and S pombe git3. Transmembrane regions (TM1–7) are indicated in red, residues identical for at least two aligned sequences are in white letters on a dark blue background, residues similar in at least two sequences are shaded in light blue. (B) Alignment of human Gi1 and Gs1, and S. cerevisiae Gpa1 and Gpa2. Identity between Gpa1 and Gi1 is 37%, between Gpa1 and Gs1 29%; identity between Gpa2 and Gi1 is 44% compared to 34% between Gpa2 and Gs1. Residues identical in at least three aligned sequences are in white letters on a dark blue background and similar residues in at least three sequences are shaded in light blue.

An official website of the United States government
Here's how you know
Official websites use .gov
A
.gov website belongs to an official
government organization in the United States.
Secure .gov websites use HTTPS
A lock (
) or https:// means you've safely
connected to the .gov website. Share sensitive
information only on official, secure websites.
