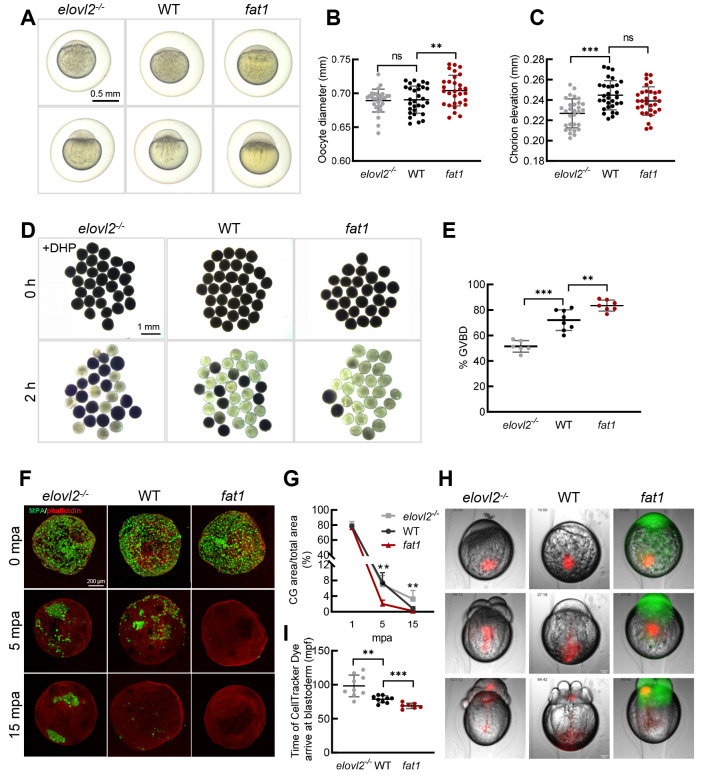
Figure 2.
DHA promotes oocyte quality
A: Representative images of WT, fat1, and elovl2-/- embryos with chorions at 15 and 40 minutes post-fertilization (mpf). Scale bar: 250 μm. B: Measurement of oocyte diameter at 15 mpf. n=30. C: Measurement of chorion elevation at 15 mpf. n=30. D: Representative images of GVBD assay of WT, fat1, and elovl2-/- follicles. Scale bar: 1 mm. E: Quantitative results of GVBD assay. F: Maximum z-projection of phalloidin (red) and Maclura pomifera agglutinin (MPA) (green) staining of activated WT, fat1, and elovl2-/- eggs fixed at 1, 5, and 15 min post-activation (mpa). Scale bar: 50 μm. G: Statistical analysis of total CG positive areas (%) in WT, fat1, and elovl2-/- eggs. H: Representative images of cytoplasmic movement in WT, fat1, and elovl2-/- embryos. Images are from time-lapse movies of individual embryos from 15 to 120 mpf injected with CellTracker Dye immediately after fertilization. Scale bar: 100 μm. Number in upper left of image in panel I represents mpf. l: Quantification analysis of cytoplasmic movement in WT, fat1, and elovl2-/- embryos. Quantification is defined as time of CellTracker Dye arrival in blastoderm. At least seven embryos were measured per group. All values are mean±SD. Student’s t-tests were used in panels B, C, E, I. Multiple t-tests-one per row were used in panels G. ns: No significance; *: P<0.05; **: P<0.01; ***: P<0.001.

