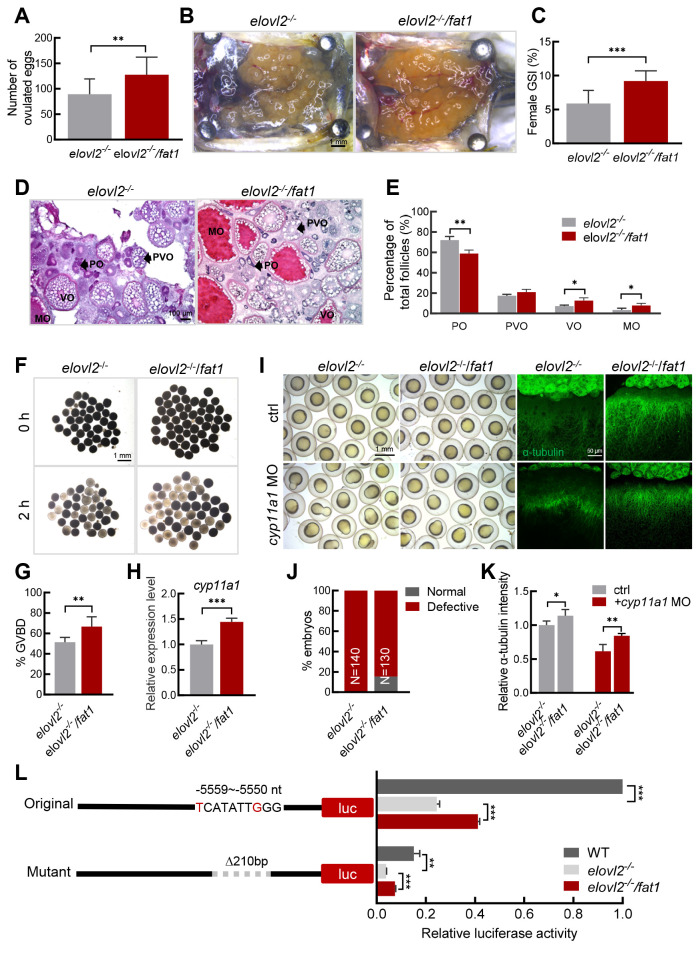
Figure 5.
fat1 transgene restores fecundity of elovl2-/- mutant
A: Number of eggs laid by elovl2-/- (n=14) and elovl2-/-/fat1 (n=16) female zebrafish. B: Overview of dissected ovaries from elovl2-/- and elovl2-/-/fat1 zebrafish on day after ovulation at 180 dpf. Scale bar, 1 mm. C: GSI of elovl2-/- (n=10) and elovl2-/-/fat1 (n=7) zebrafish on day after ovulation. D: H&E staining of elovl2-/- and elovl2-/-/fat1 ovaries. Scale bar: 100 μm. E: Follicle quantification of elovl2-/- and elovl2-/-/fat1 ovaries on day after ovulation. At least three ovaries were measured per group. F, G: Representative images and quantitative results of GVBD assay of elovl2-/- and elovl2-/-/fat1 follicles. Scale bar: 1 mm. H: Real-time qPCR of cyp11a1 expression in elovl2-/- and elovl2-/-/fat1 eggs. I: Representative images of embryo morphology and anti-α-tubulin staining of elovl2-/- and elovl2-/-/fat1 embryos with normal development or knockdown of cyp11a1. J: Statistical analysis of elovl2-/- and elovl2-/-/fat1 embryo phenotypes with normal development or knockdown of cyp11a1. Approximately 130 embryos were measured per group at 10 hpf. K: Quantitative analysis of anti-α-tubulin staining of elovl2-/- and elovl2-/-/fat1 embryos with normal development or knockdown of cyp11a1. At least five embryos per group were measured at 6 hpf. L: Schematic of reporter plasmids for cyp11a1 promoter activity analysis and luciferase assay of different types of cyp11a1 promoters in WT, elovl2-/-, and elovl2-/-/fat1 embryos at 6 hpf. All values are mean±SD. Student’s t-tests were used in panels A, C, G, H, J. Multiple t-tests-one per row were used in panel E, K, L. *: P<0.05; **: P<0.01; ***: P<0.001. Arrows indicate follicle cells at different developmental stages. PO: primary oocyte; PVO, previtellogenic oocyte; VO, vitellogenic oocyte; MO, mature oocyte. GSI, gonadosomatic index; H&E, hematoxylin-eosin.

