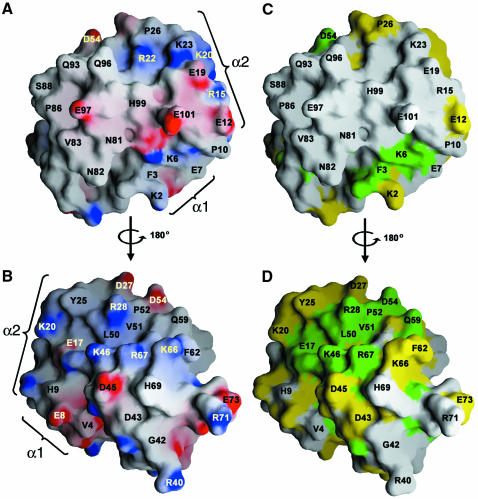
Fig. 3. Surface representations of GABARAP. (A) Electrostatic potential map of GABARAP surfaces (B, rotated by 180°). Regions of electrostatic potential less than 20 kBT are shown in red and those greater than +20 kBT are shown in blue (kB, Boltzmann constant; T, absolute temperature). (C and D) Representation of GABARAP in which identical (green) and homologous (yellow) residues are mapped to the protein surface using the sequence alignment shown in Figure 2. Orientations are identical to those shown in (A) and (B) and show that surface residues are conserved on one side of the molecule (C) but not on the other (D). Note the charged surface around α-helix 2 (region 1) (A) and a cleft lined by basic residues on the opposite side of the molecule (region 2) (B), which are highly conserved. Positions of α-helices 1 and 2 are marked. This figure was generated using the program GRASP (Nicholls et al., 1991).

An official website of the United States government
Here's how you know
Official websites use .gov
A
.gov website belongs to an official
government organization in the United States.
Secure .gov websites use HTTPS
A lock (
) or https:// means you've safely
connected to the .gov website. Share sensitive
information only on official, secure websites.
