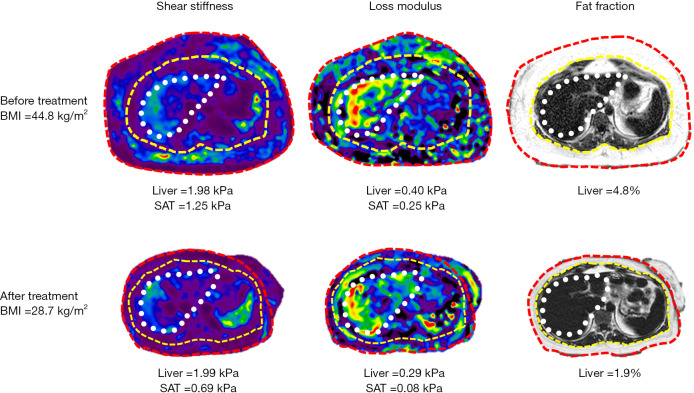
Figure 1.
A 33-year-old female with obesity underwent bariatric surgery for obesity and showed good response. MRI with MRE was performed before and after treatment. MRE derived shear stiffness map and loss modulus map, and PDFF maps before (top row) and after (bottom row) bariatric surgery. The SAT is between yellow and red broken lines. The white dotted line represents the outline of the liver. Note the improvement in the shear stiffness of the SAT while there is no significant improvement in liver shear stiffness. Loss modulus improved in both liver and SAT suggesting improvement in the inflammation of subcutaneous fat and liver. The liver PDFF also improved post treatment. BMI, body mass index; SAT, subcutaneous adipose tissue; MRI, magnetic resonance imaging; MRE, magnetic resonance elastography; PDFF, proton density fat fraction.

