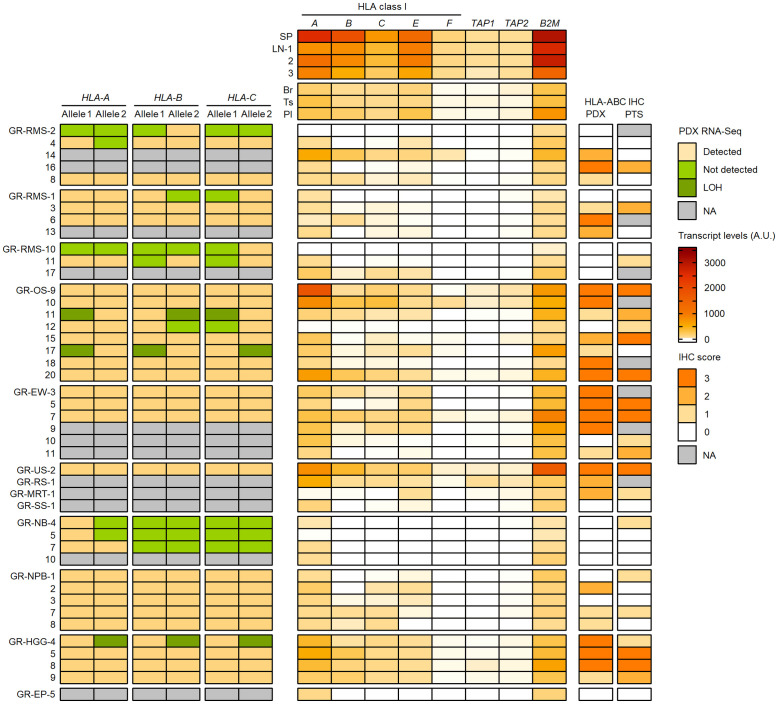
Figure 11.
Detection of HLA class I alleles, quantification of HLA and APP transcripts, and IHC scores in PDX models in comparison with primary tumor samples. HLA class I (A–C) alleles detected (light brown) or not (green) from PDX WES and RNA-Seq in comparison with normal and patient tumor NGS data are illustrated on the left panel. The upper, middle and lower RMS groups correspond to eRMS, aRMS, and other RMS PDXs, respectively. Patterns consistent with HLA class I LOH are indicated in dark green. Relative transcript levels (arbitrary units, A.U. x100) of HLA class I classical (A–C) and nonclassical (E, F) genes, TAP1, TAP2 and B2M as quantified by RT-qPCR (Taqman assay) in selected normal tissues (top) and PDXs (bottom) are shown on the middle panel. HLA class I IHC scores (using the EMR8-5 mAb) in comparison between PDXs and the corresponding primary tumor specimens are indicated on the right panel.

