
Figure 1. IFN-g -producing cells after immunizations.
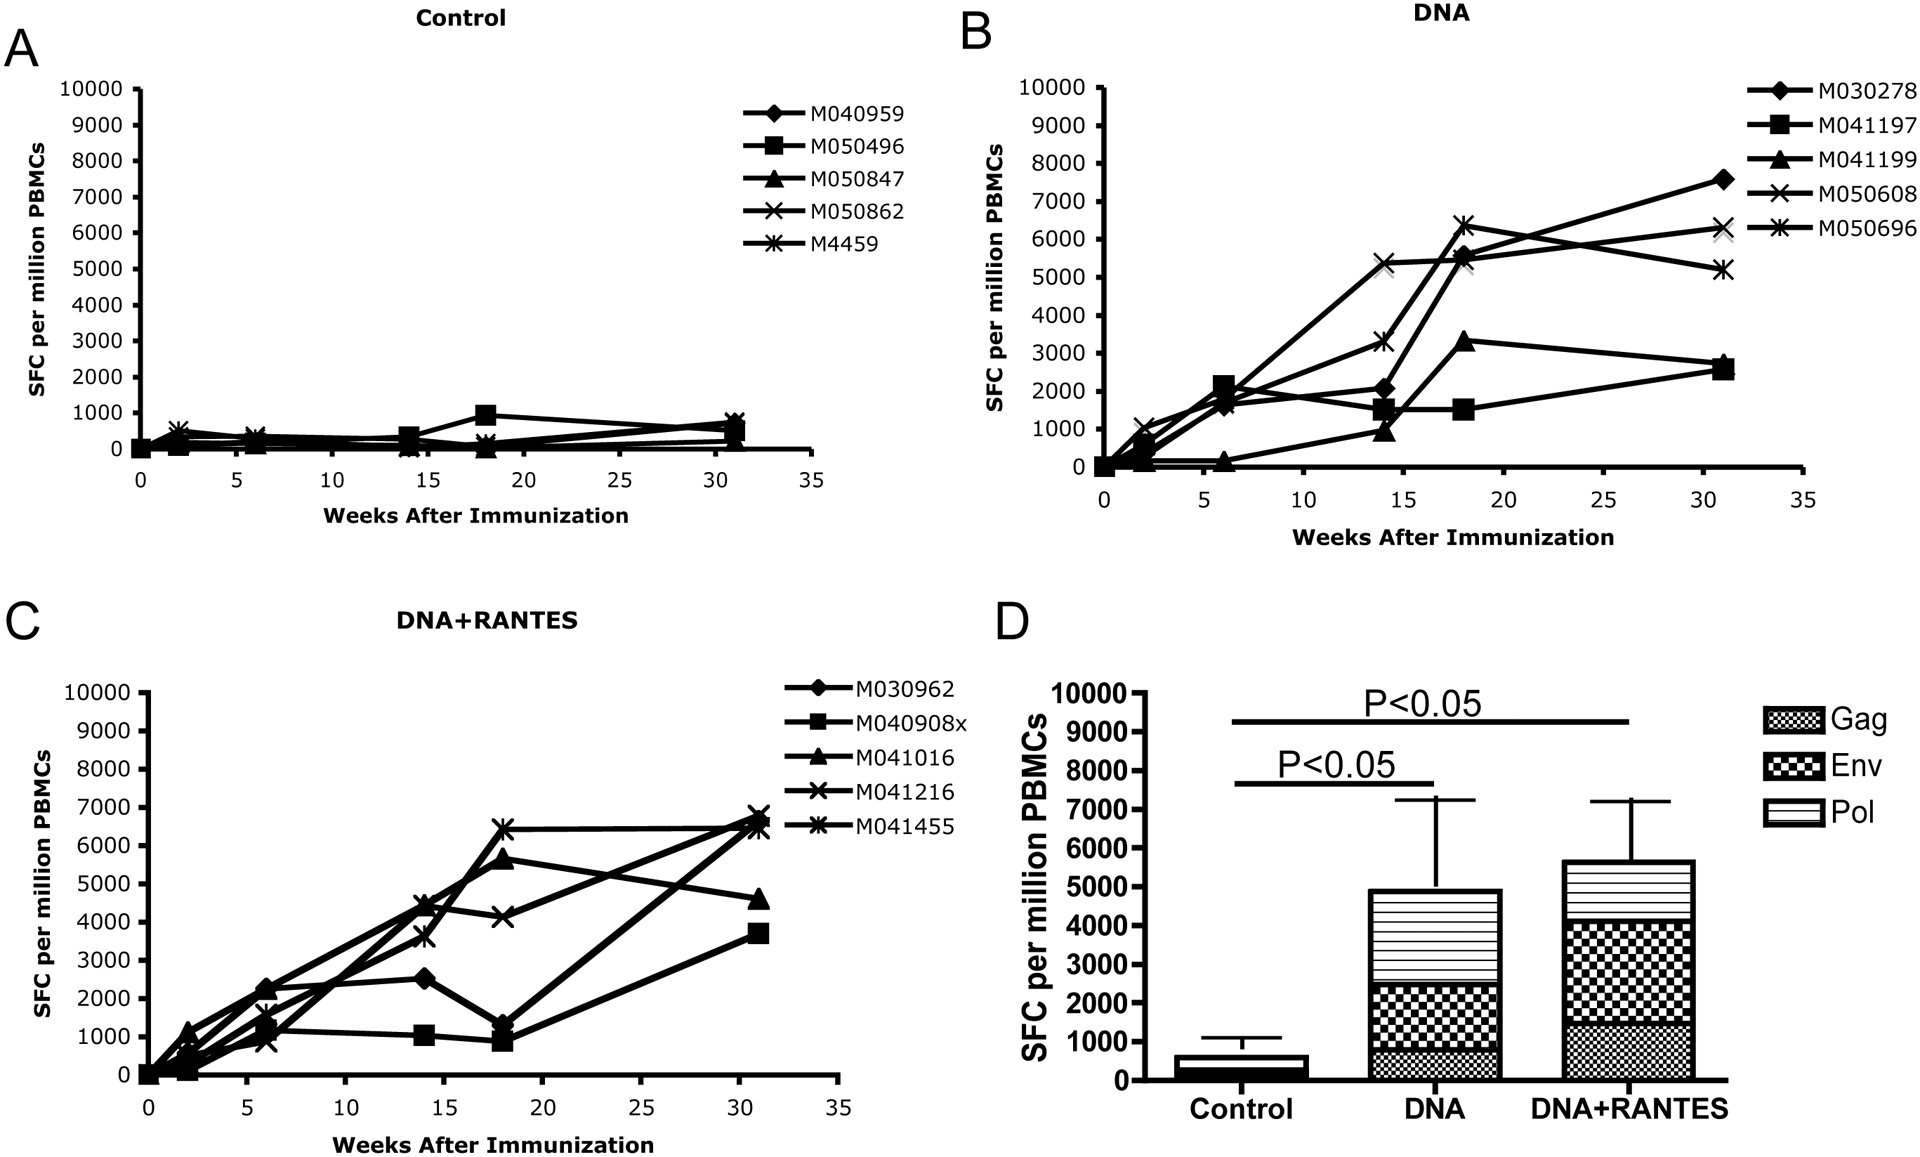
Samples were taken two weeks after each immunization. PBMCs were isolated by a standard percoll separation technique and assessed for antigen specific IFN-g immune response in the control group (A), DNA group (B), and DNA + RANTES group (C). (D) Average level of IFN-g producing cells after immunizations 1–5 with control, SHIV DNA vaccine alone, and SHIV DNA vaccine + RANTES adjuvant. The data represent the number of cells able to secrete IFN-g after each immunization.