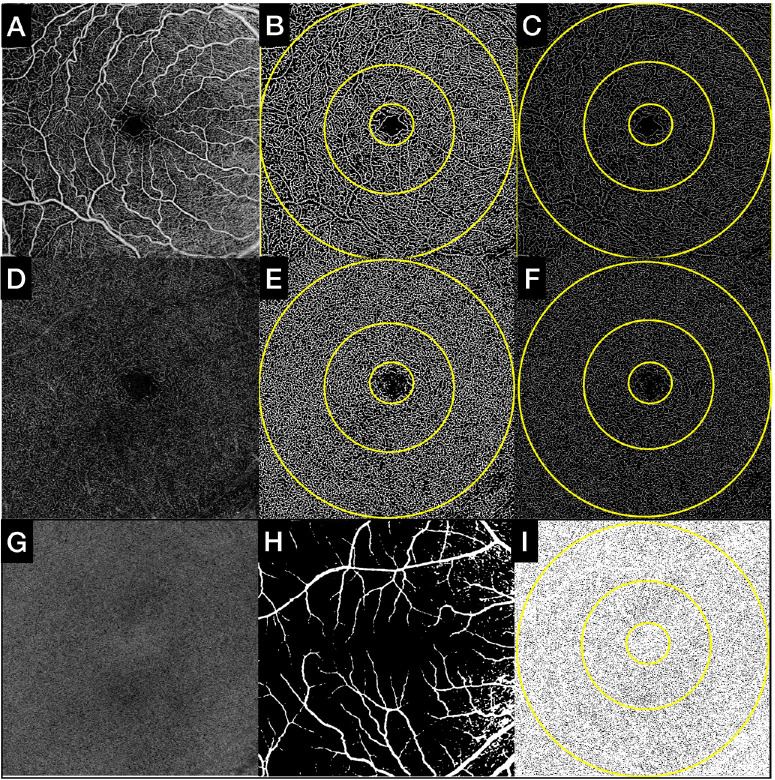
Figure 2.
Quantitative analysis of SVC, DVC, and CC in subjects without cognitive impairment. (Upper row, A–C) (A) Default SVC OCTA en face slab as exported from the OCTA device (6 × 6 mm; 1024 × 1024 pixels). (B) Binarized SVC OCTA en face slab used to compute the PD assessment. (C) Skeletonized SVC OCTA en face slab used to compute the VLD assessment. (Middle row, D–F) (D) Default DVC OCTA en face slab as exported from the OCTA device (6 × 6 mm; 1024 × 1024 pixels). (E) Binarized DVC OCTA en face slab used to compute the PD assessment. (F) Skeletonized DVC OCTA en face slab used to compute the VLD assessment. (Lower row, G–I) (G) Custom 16-µm-thick CC OCTA en face slab positioned 4 µm below BM. (H) Superficial mask that was overlapped to the CC slab; large and superficial vessels were eliminated from the computation of CC flow deficits. (I) CC OCTA en face slab binarized with superficial mask overlapped was used to quantify the CC flow deficits. All measurements were computed in the slab and the 3-mm and 6-mm ETDRS rings, as shown by the overlapped rings in B, C, E, F, and I.

