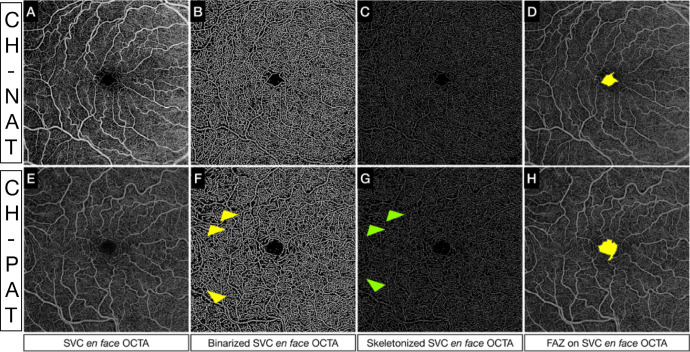
Figure 3.
Quantitative analysis of SVC in a CH-PAT versus CH-NAT. (Upper row, A–D) (A) Superficial en face OCTA slab, (B) binarized superficial en face OCTA slab, (C) skeletonized superficial en face OCTA, and (D) segmented FAZ using a superficial en face OCTA slab in a CH-NAT subject. (Bottom row, E–H) (E) Superficial en face OCTA slab, (F) binarized superficial en face OCTA slab, (G) skeletonized superficial en face OCTA, and (H) segmented FAZ using a superficial en face OCTA slab in a CH-PAT subject. In G and H, we can appreciate the decreased PD (yellow arrows) and VLD (green arrows), respectively, in the outermost region of the OCTA slab from an eye of a CH-PAT subject.

