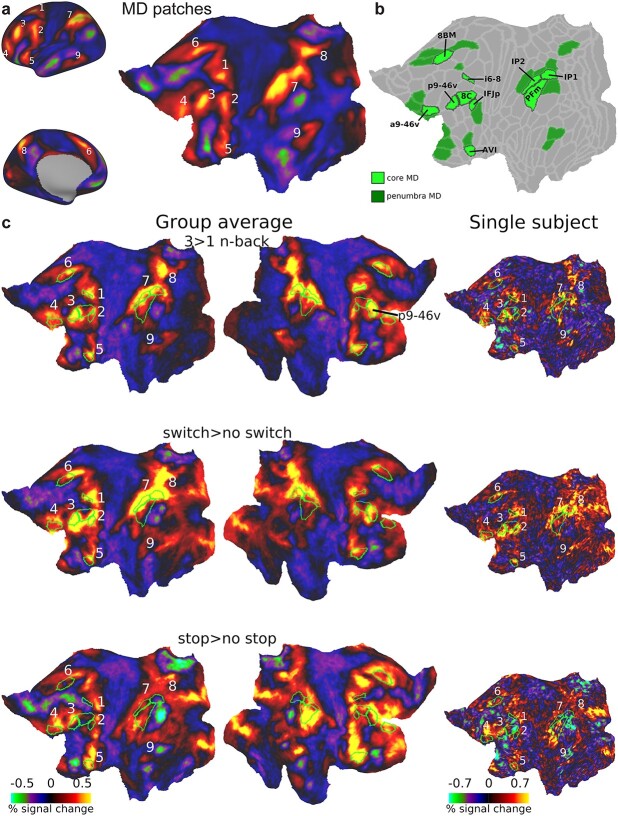
Fig. 1.
(a) The 9 MD patches displayed on cortical surface (left) and a flattened left surface (right) as revealed by average activations of 449 subjects based on 3 cognitively demanding contrasts from Assem et al. (2020): 2 > 0 n-back, hard>easy reasoning, math>story. (b) Extended MD system from Assem et al. (2020). Core MD regions are colored in bright green surrounded by black borders and individually labeled. Penumbra MD regions are colored in dark green. Data available at: http://balsa.wustl.edu/r27NL. (c) Flat cortical maps overlaid with group average activations for each executive contrast in the current study. Green borders surround core MD areas, with the 9 coarser-scale patches labeled on the left hemisphere. Right column shows example activation from a single subject on the left hemisphere. See Supplementary Fig. 1 for more single subject activations. All single subject data are available at: http://balsa.wustl.edu/x8M0q.

