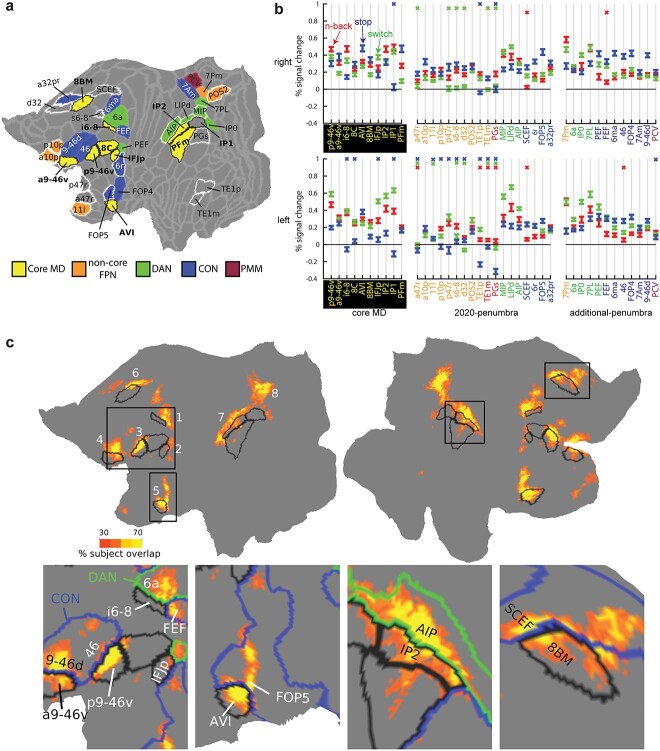
Fig. 3.
The unity of executive functions. (a) Cortical parcels showing conjunction of significant activation in each of the 3 executive contrasts (P < 0.05 Bonferroni corrected). All unique areas identified in either hemisphere are projected on the left hemisphere, and colored according to RSN membership from Ji et al. (2019). Black borders surround core MD, white borders surround 2020-penumbra areas. Note PEF’s RSN membership is CON on the right hemisphere. Data available at: http://balsa.wustl.edu/P2MXl. (b) Areal responses to each of the 3 contrasts. A colored X means the area did not survive Bonferroni correction for 360 areas (P < 0.05); red n-back, blue stop, green switch). Colors of areal names show RSN membership (color scheme as in (a), with the addition of red = DMN). (c) Subject overlap map of cortical vertices that were significantly activated in all 3 executive contrasts for individual subjects (P < 0.05 FDR corrected). Black borders surround core MD. Colored borders show RSN membership (CON = blue, DAN = green). Data available at: http://balsa.wustl.edu/7x6l7.

