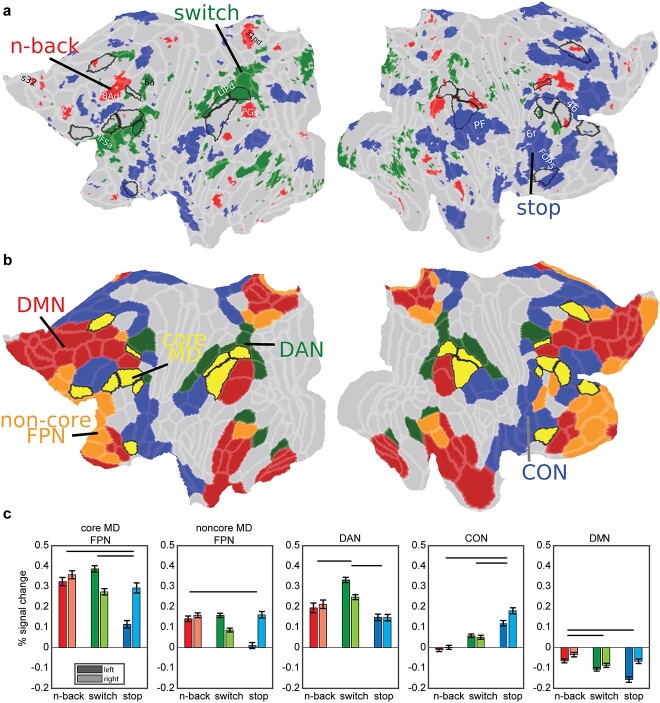
Fig. 4.
The diversity of executive functions. (a) Task functional preferences. Each vertex is colored with the task that significantly activated it more than each of the other 2 tasks (P < 0.05 FDR corrected across vertices and Bonferroni corrected for 3 tasks; red: 3 > 1 n-back, green: switch>no switch, blue: stop>no stop). Core MD areas are surrounded by a black border. (b) Canonical RSNs from the HCP based 12 network parcellation by Ji et al. (2019) (red: DMN, green: DAN, blue: CON, yellow with black borders: core MD in FPN, orange with gray borders: noncore MD FPN). Note similarity in the topographical organization with each task preference in (a). Data available at: http://balsa.wustl.edu/647Nr. (c) Task activations for each of the 5 networks in (b). Error bars are SEMs. Darker colored bars for left hemisphere, lighter colored bars for right hemisphere. Horizontal black lines compare significance between tasks collapsed across hemispheres (P < 0.05 Bonferroni corrected for 3 tasks and 5 networks).

