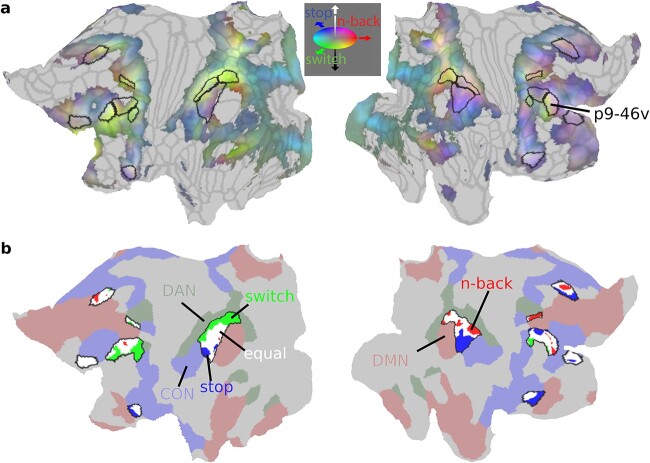
Fig. 5.
Sub-areal task preferences. (a) Cortical projection of the RGB color weighted normalized task profiles. Reddish colors mean stronger n-back activity, bluish colors mean stronger stop contrast activity and greenish colors mean stronger switch contrast activity. Core MD areas are surrounded by black borders. (b) Vertex-level statistical comparison of activations within core MD regions. N-back preferring vertices are in red, switch vertices in green, and stop vertices are in blue. White vertices denote nonsignificant statistical differences between tasks (P < 0.05 FDR corrected). Surrounding core MD regions (black borders) are canonical RSNs from Ji et al. (2019) (red: DMN, green: DAN, blue: CON). Data available at: http://balsa.wustl.edu/1p0wB.

