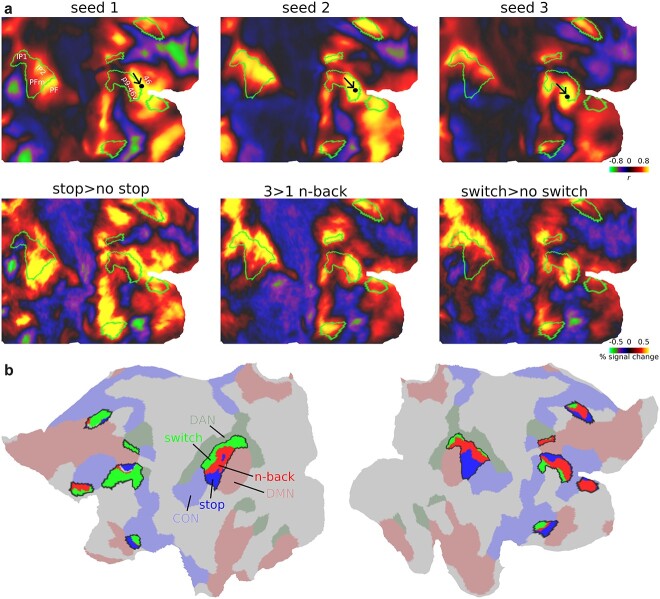
Fig. 6.
Core MD connectivity gradients. (a) Top row: connectivity map of 3 seeds within right p9-46v. Bottom row: group average activations for each executive contrast. Core MD regions shown with green outlines. Data available at: http://balsa.wustl.edu/5BPVB. (b) Core MD vertices colored using a winner-take all approach: blue, red, green for vertices where more subjects overlapped for stop, n-back, switch, respectively. Surrounding core MD regions (black borders) are canonical RSNs from Ji et al. (2019) (red: DMN, green: DAN, blue: CON). Data available at: http://balsa.wustl.edu/n82L9.

