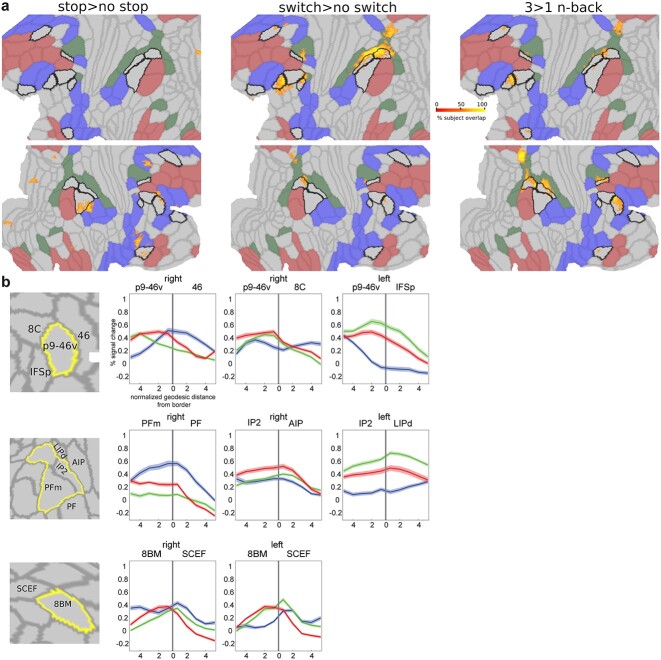
Fig. 7.
Peak activations at region borders. (a) Subject overlap map of top 5% activated voxels for each contrast. Core MD borders are colored in black and the remaining MMP1.0 areas borders are in light gray. RSNs are colored as follows: DMN is red, DAN is green, and CON is blue. Data available at: http://balsa.wustl.edu/gmNwX. (b) First column represents a close up of cortical areas of interest (top: lateral prefrontal, middle: lateral parietal, bottom: medial frontal). Remaining columns display example activation profiles near areal borders, highlighting the hemisphere –right or left- with the strongest pattern. N-back activations are in red, stop in blue, and switch in green. Shaded areas represent SEMs. The location of the border is marked by a vertical gray line at the zero point of the x axis.

