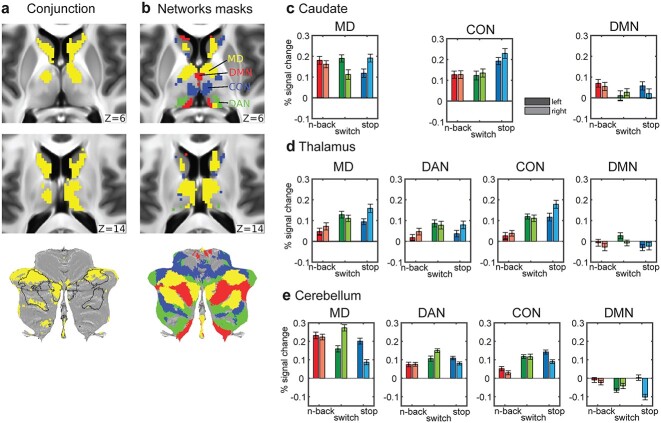
Fig. 8.
Conjunctions and task preferences in subcortex and cerebellum. (a) Subcortical axial slices and a cerebellar flat map showing surviving voxels in caudate, thalamus, and cerebellum for the conjunction of significantly activated voxels for each of the 3 executive contrasts (P < 0.05 FDR corrected for each structure separately). (b) Voxels belonging to each network (yellow = MD, green = DAN, blue = CON, red = DMN). MD caudate, thalamic, and cerebellar voxels are from Assem et al. (2020). The other 3 RSN definitions are from Ji et al. (2019) [see Materials and Methods for more details]. Data available at: http://balsa.wustl.edu/Bgp6w. (c)–(e) Bar plots of activations across subjects for each hemisphere, network, and structure. Darker colored bars are for left hemisphere and lighter colored ones for the right hemisphere. Error bars are SEMs.

