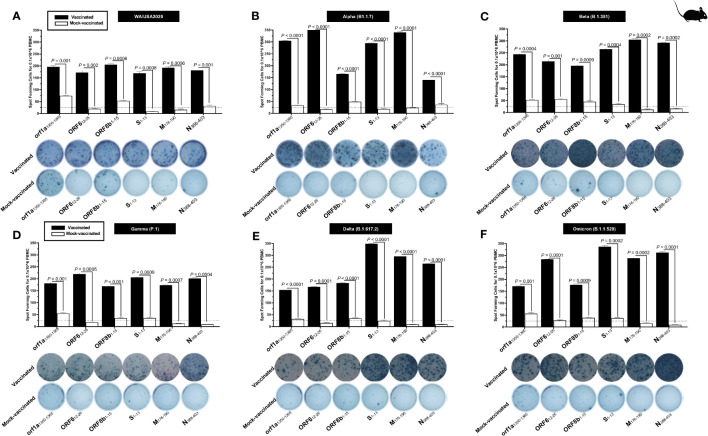
Figure 6.
The magnitude of the IFN-γ CD4+ T- cell responses for six conserved SARS-CoV-2 CD4+ T- cell epitopes in triple transgenic HLA-A*02:01/HLA-DRB1*01:01-hACE-2 mice: ELISpot images and bar diagrams showing average frequencies of IFN-γ producing cell spots from mononuclear cells from lung tissue (1 × 10⁶ cells per well) of vaccinated and mock-vaccinated mice challenged with (A) WA/USA2020, (B) Alpha (B.1.1.7), (C) Beta (B.1.351), (D) Gamma (P.1), (E) Delta (B.1.617.2), and (F) Omicron (B.1.1.529). Mononuclear cells from lung tissue were collected 14 days post-infection. Cells were stimulated for 48 h with 10 mM of six immunodominant CD4+ T- cell peptides derived from SARS-CoV-2 structural (Spike, Envelope, and Membrane) and non-structural (orf1ab, ORF6, ORF7b, ORF8a, and ORF10) proteins. The bar diagrams show the average/mean numbers (± SD) of IFN-γ-spot forming cells (SFCs) after CD8+ T- cell peptide stimulation in lung tissues of vaccinated and mock-vaccinated mice. The dotted lines represent an arbitrary threshold set to evaluate the relative magnitude of the response. A strong response is defined for mean SFCs > 25 per 1 × 10⁶ stimulated PBMCs. Results were considered statistically significant at p ≤ 0.05.

