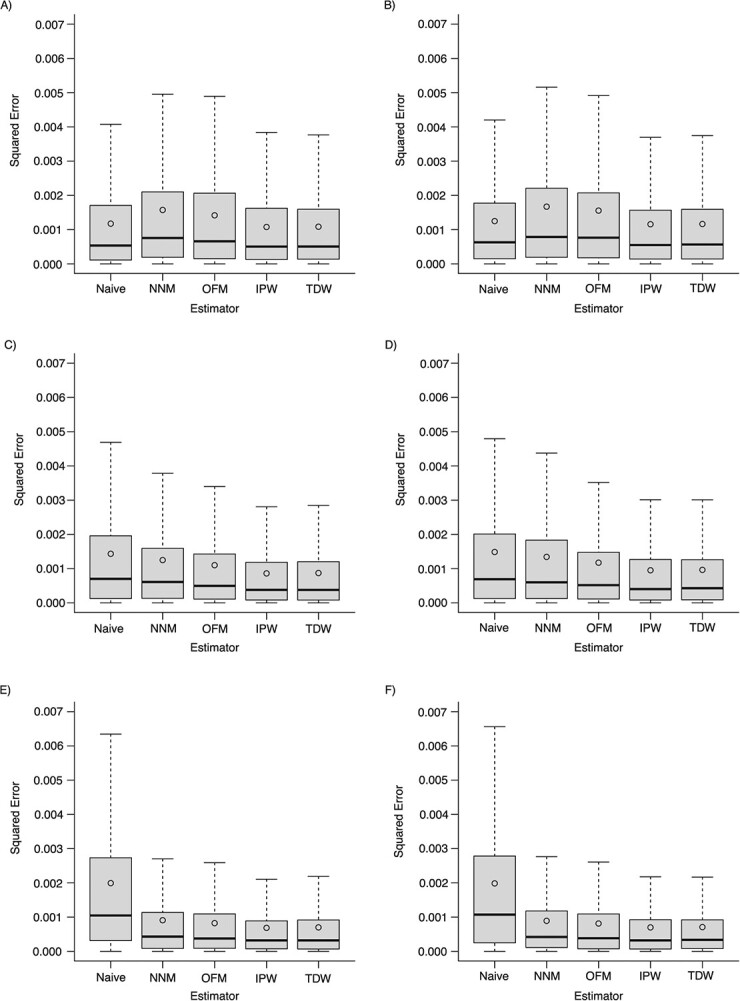
Figure 2.

Squared error of estimates of the average treatment effect in the treated (ATT), according to different estimators based on the disease risk score across simulations. Scenarios: A) weak confounding and no effect modification; B) weak confounding and the presence of effect modification; C) moderate confounding and no effect modification; D) moderate confounding and the presence of effect modification; E) strong confounding and no effect modification; F) strong confounding and the presence of effect modification. NNM, nearest-neighbor matching; OFM, optimal full matching; IPW, inverse probability weighting; TDW, target distribution weighting. The top and bottom of the box represent the 75th and 25th percentiles; the horizontal line inside the box represents the median; and the whiskers extend to the most extreme data point, which is no more than 1.5 times the interquartile range from the box. The circle inside the box is the mean.
